 Bezier
![]()
Sketch a multiple point bezier curve with points along the bezier curve's control polygon. The bezier curve follows the path of its control polygon.
The Bezier sketch tool allows you to sketch a multiple point bezier curve with points along the bezier curve's control polygon. The bezier curve follows the path of its control polygon.
Click the Sketch feature on the feature toolbar to create a new sketch. Select a plane in the graphics area.
Select the Bezier sketch tool on the sketch toolbar. Click a location in the graphics area to place the start point. Click additional points to establish additional locations along the curve. Double-click a location to create the end point of the curve.
As bezier points are created, a controlled polygon that the bezier curve follows is also created. The control points can be moved by drag and drop, as the lines and sketches can also be controlled with constraints and dimensions. This combination results in a well controllable curve.
Steps
-
Click
 .
.
- Click to start, click to establish points, double-click to end.
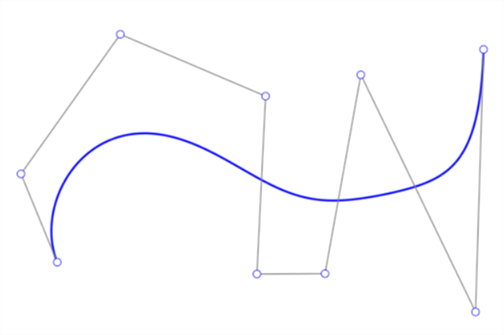
Example of the bezier curve (blue), control polygon (black), and control points (white circles).
Adjusting the Bezier curve
- Ensure the Bezier curve sketch tool is deselected on the Sketch toolbar.
- Click and drag any control point (white point) along the bezier curve's control polygon to make adjustments to the curve.
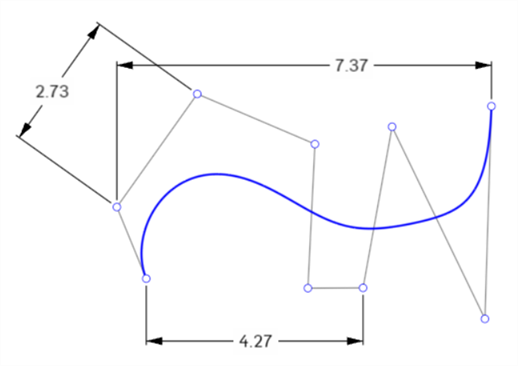
You can use the bezier control points with dimensions:
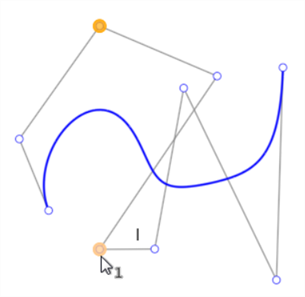
You can use bezier control points with constraints. For example, the two orange highlighted points in the image below are vertically constrained:
Tips
- A bezier curve cannot be a closed loop (the first control point connected to the last control point). Use the Spline tool to create a closed loop.
- You can add more control points with the Spline control point tool.
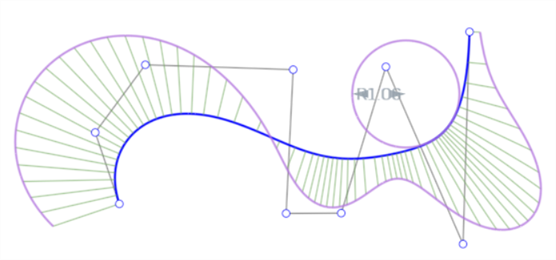
- Visualize the curvature in more detail with the
Curve/surface analysis
context menu command:
-
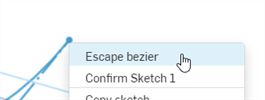
Use the right-click context menu > Escape bezier to exit the bezier creation. This removes the current bezier curve:
-
Edit the degree of a Bezier sketch entity by double-clicking on the degree to activate the field, then enter the preferred number of degrees. Press enter on your keyboard to accept. (The maximum degree of Bezier curves created is 15.)