![]()
![]()
![]()
The My analytics filter displays all your saved dashboards and any dashboards shared with you. You must have permissions to edit and save new dashboards, so they are displayed in this filter.
If changes are made to any dashboard (filters are edited or customizations made), these changes can be saved to a new dashboard. see Save a dashboard for more information.
To export data for a dashboard visual, see Export visual data to a CSV or Excel file.
See Working with Analytics dashboards and Working with Analytics dashboard visuals for additional information.
Click Analytics (![]() ) from the Document panel on the left. By default, the My analytics filter is selected in the Analytics Navigation panel:
) from the Document panel on the left. By default, the My analytics filter is selected in the Analytics Navigation panel:
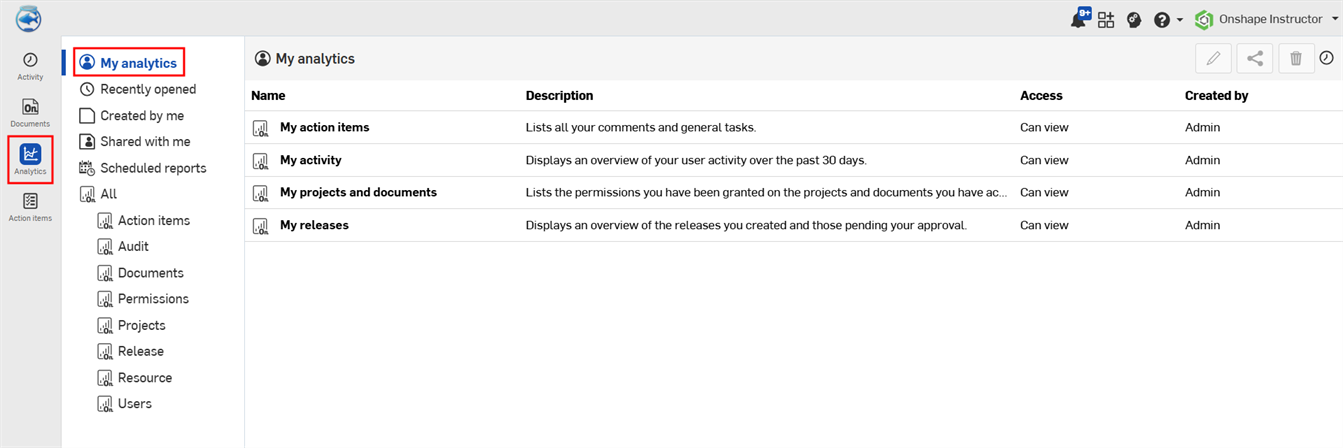
My analytics columns
- Name - Dashboard name
- Description - Brief explanation of each item in the Name column
- Access - User dashboard permission level. Permission levels are Owner, Can edit, and Can view.
- Created by - User who created the dashboard
Default My analytics dashboards
- My Action Items - A list of all your comments and general tasks.
- 내 활동 - 지난 30일 동안 사용자 활동의 개요.
- 내 프로젝트 및 통합문서 - 액세스 권한을 가진 프로젝트와 통합문서에 부여한 권한.
- 내 릴리스 - 생성을 완료하고 승인 보류 중인 릴리스의 개요.
This dashboard contains a single table visual that lists all your comments and general tasks. This dashboard is unfiltered. See Action items for a filtered version of the same dashboard.
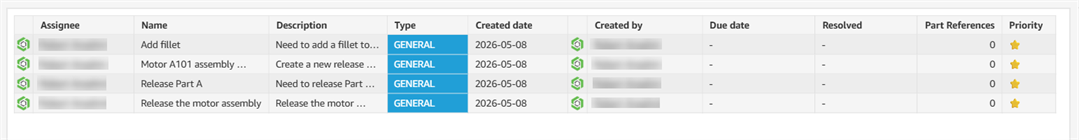
Visual columns
- Assignee - User to whom the action item is assigned
- Name - Action item name
- Description - Brief Action item description
- Type -Action item type; Comment or General
- 작성일 - 작업 항목이 생성된 날짜
- Created by - Name of the user that created the action item
- Due date - Date the action item is due, if applicable
- Resolved - Date the action item was resolved, if applicable
- Part reference - Part the action item is referencing, if applicable
- Priority - Priority of the action item, if applicable
This dashboard is an overview of user activity.
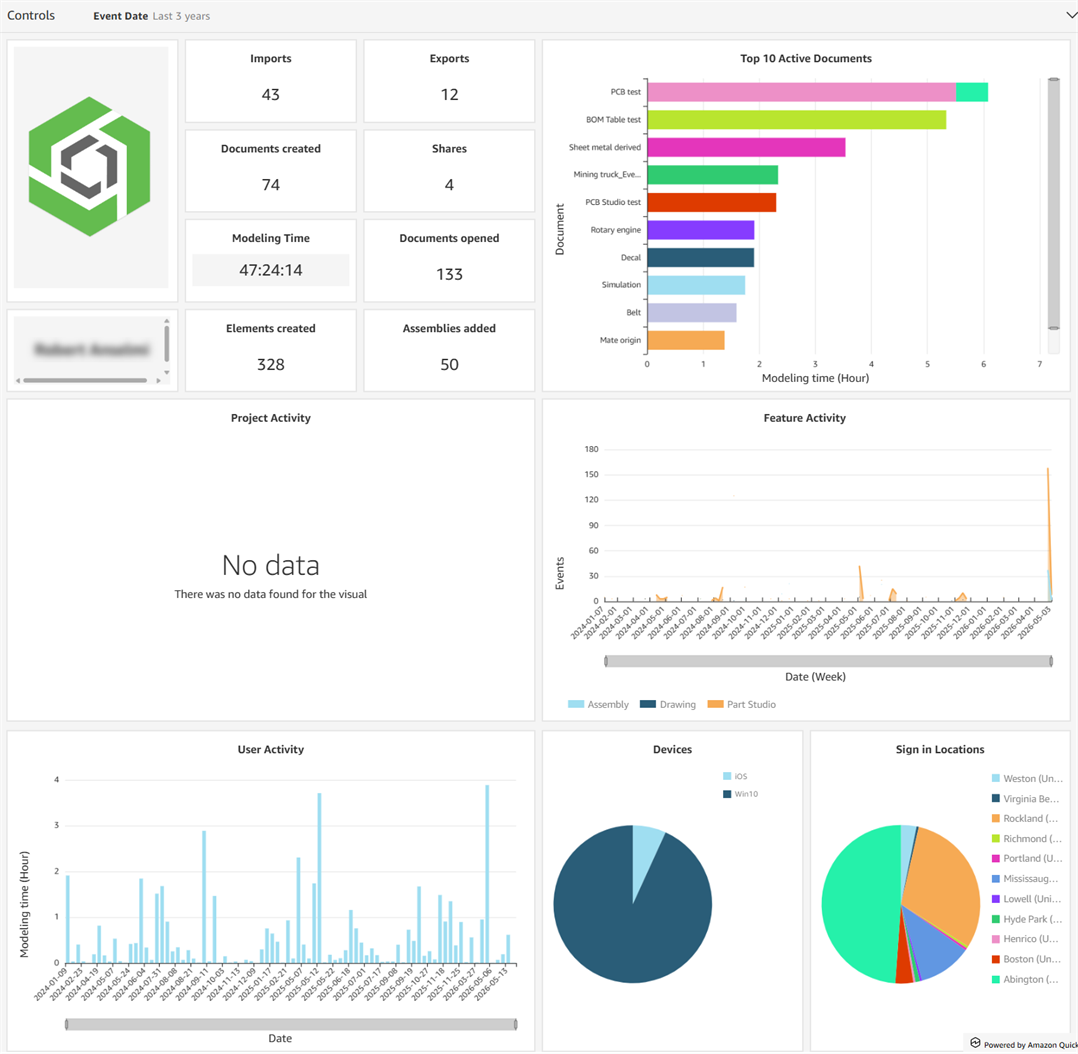
Filter control
-
Event date - Date, date range, or period of time in which to search for acitivity
Visuals
-
User avatar - User image
-
User name - User name
-
Imports - Count visual displaying number of documents imported
-
Exports - Count visual displaying number of documents exported
-
Documents created - Count visual displaying number of documents created
-
Shares - Count visual displaying number of documents the user shared
-
Modeling time - Count visual displaying the amount of time used modeling in hours, minutes, and seconds.
-
Documents opened - Count visual displaying number of documents opened
-
Elements created - Count visual displaying number of tabs created
-
Assemblies added - Count visual displaying number of assemblies created
-
Top 10 active documents - Horizontal bar chart visual of the top 10 most active documents (y axis) by Modeling time (x axis)
-
Project activity - Horizontal bar chart visual displaying projects (y axis) by Modeling time (x axis)
-
Feature activity - Horizontal bar chart visual displaying the Feature (y axis; Assembly, Drawing, Part Studio) by Number of events (x axis)
-
User activity - Vertical bar chart visual displaying the Modeling time (y axis) by Date (x axis)
-
Devices - Pie chart visual displaying device types used
-
Sign in locations - Pie chart visual displaying locations from which the user was signed in
This dashboard lists permissions granted on projects and documents to which you have access, This dashboard is unfiltered.
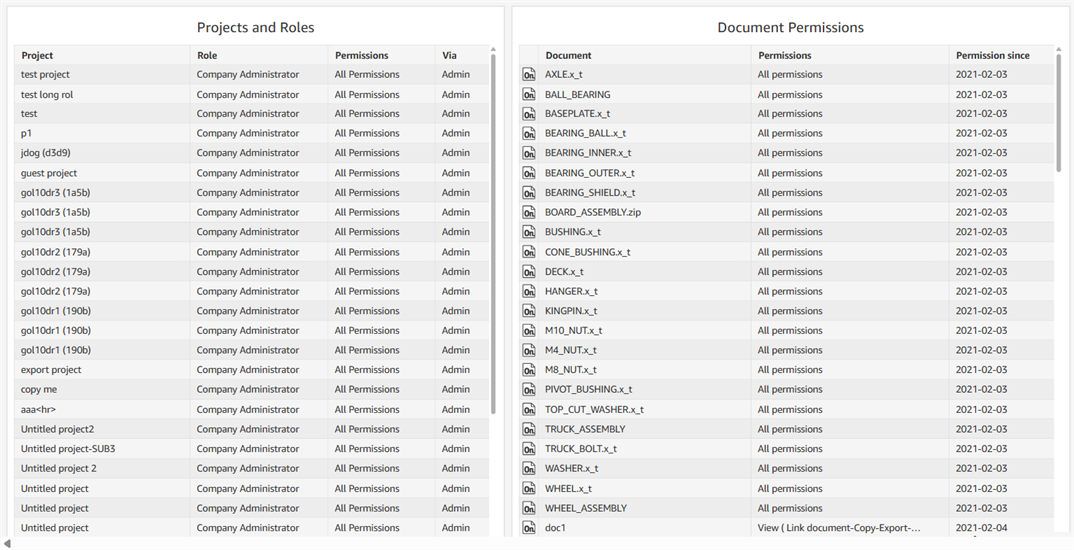
Visuals
- Projects and roles - Table visual displaying projects and roles. Columns are Project, Role, Permissions, and Via.
- Document permissions - Table visual displaying document permissions. Columns are Document, Permissions, and Permission since.
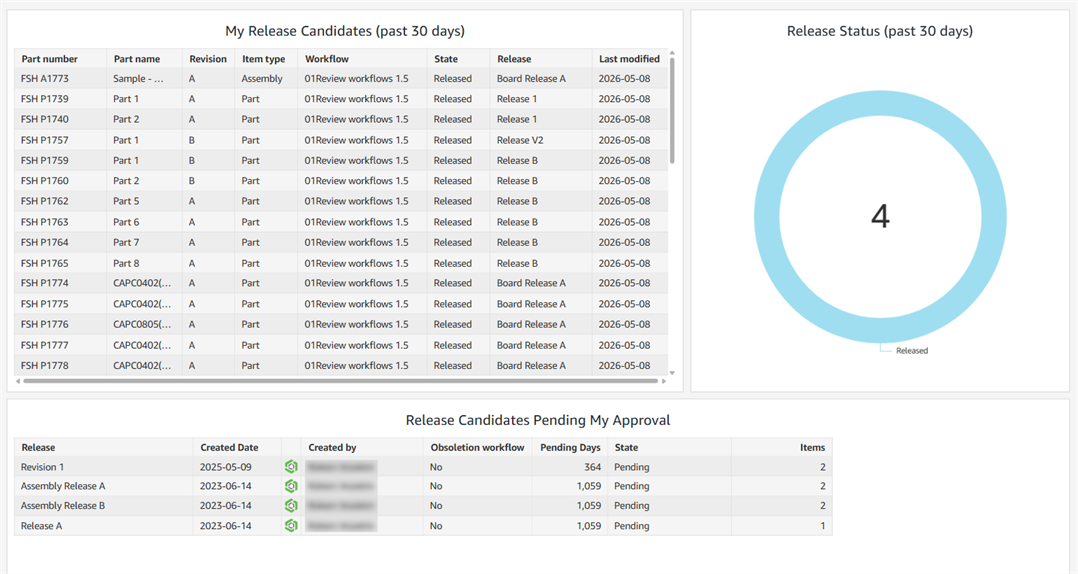
This dashboard is an overview of the releases you created and those pending your approval during the last 30 days. This dashboard is unfiltered.
Visuals
-
My release candidates (past 30 days) - Table visual displaying your Release candidates for the previous 30 days. Columns are Part number, Part name, Revision, Item type, Workflow, State, Release, and Last modified.
-
Release status (past 30 days) - Donut chart visual displaying the number of releases in the past 30 days
-
Release candidates pending my approval - Table visual displaying Release candidates that are pending your approval. Columns are Release, Created date, Created by, Obsoletion workflow, Pending days, State, and Items.