![]()
Audit dashboards summarize the events occurring on a specific document, or for a specific user, in a specified time frame.
If changes are made to any dashboard (filters are edited or customizations made), these changes can be saved to a new dashboard. see Save a dashboard for more information.
To export data for a dashboard visual, see Export visual data to a CSV or Excel file.
See Working with Analytics dashboards and Working with Analytics dashboard visuals for additional information.
Click Analytics (![]() ) from the Document panel on the left. Then click the Audit filter in the Analytics Navigation panel:
) from the Document panel on the left. Then click the Audit filter in the Analytics Navigation panel:
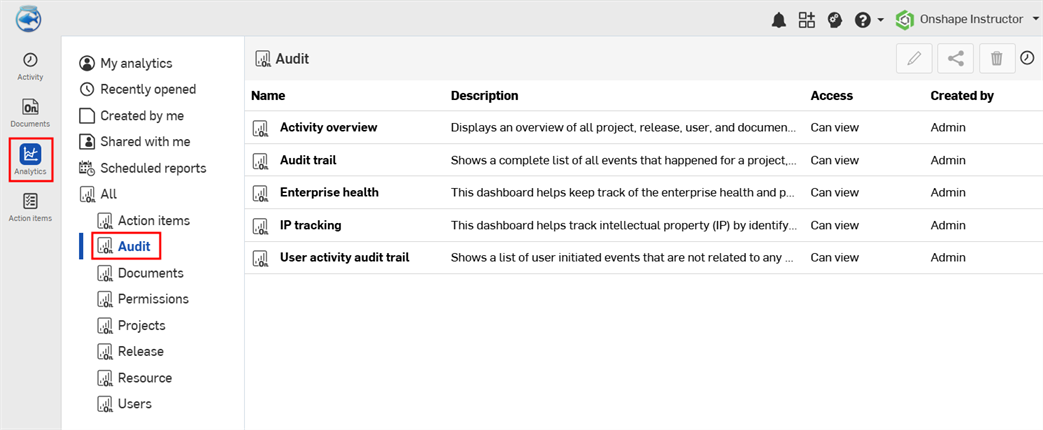
Default Audit dashboards
- Activity overview - The overview of users' activity and the activity taken on documents.
- Audit trail - List of all events happening on each specific document for a specific user in a specific time frame.
- Enterprise health - Keeps track of all the enterprise health and performance.
- IP tracking - Lists information regarding all document exports, copies, transfers, and access locations.
- User activity audit trail - Lists events initiated by users including: document name, event type (description), user name, and location.
This dashboard displays an overview of all project, release, users, and document activity in a given time frame.
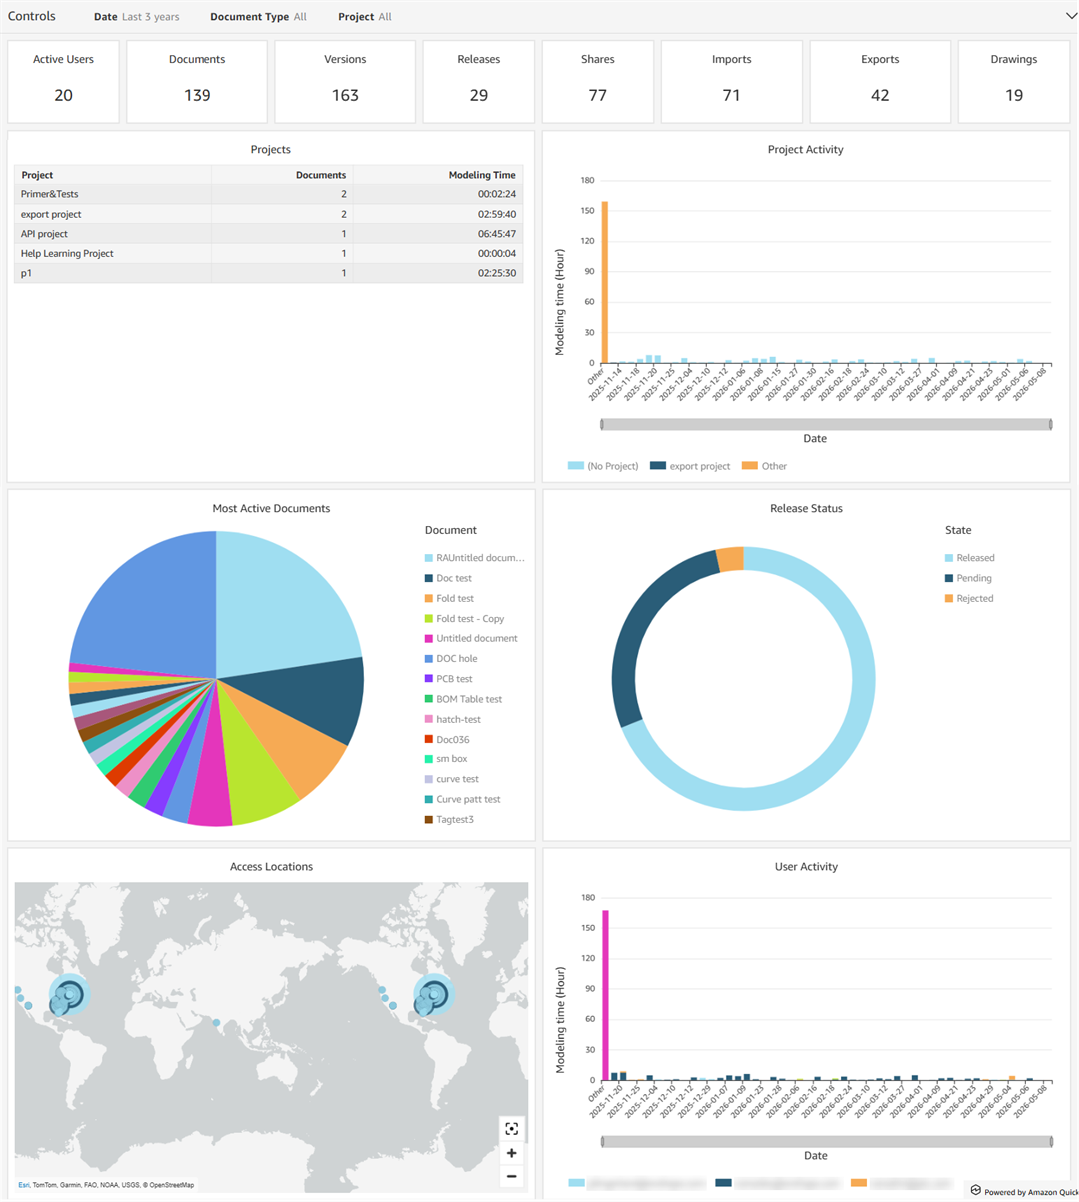
Filter controls
-
Date - The date, date range, or period of time in which to search
-
Document type - Document or Publication
-
Project - Project name
Visuals
- Active users - Count visual displaying number of active users for documents in the projects
- Documents - Count visual displaying number of documents created for the project
- Versions - Count visual displaying number of document versions for documents in the projects
- Releases - Count visual displaying number of releases in the documents in the projects
- Shares - Count visual displaying number of times the documents in the projects were shared
- Imports -Count visual displaying number of import operations in the projects
- Exports - Count visual displaying number of export operations in the projects fulfilling the filter criteria .
- Drawings - Count visual displaying number of drawings in the documents in the projects
- Projects -Table visual displaying all projects, including name, number of documents in each project, and total modeling time to date
- Project activity - Vertical bar chart displaying modeling activity by date and color-coded by project
- Most active documents - Pie chart visual displaying percentage of time spent in each document
- Release status - Donut chart visual displaying percentage of documents with any release status. Statuses include: Release, Rejected, and Pending
- Access locations - Map visual displaying locations of all Onshape sign-ins
- User activity - Vertical bar chart visual displaying time spent modeling by each user
This dashboard displays every event on a specific document or for a specific user for a specific time frame.
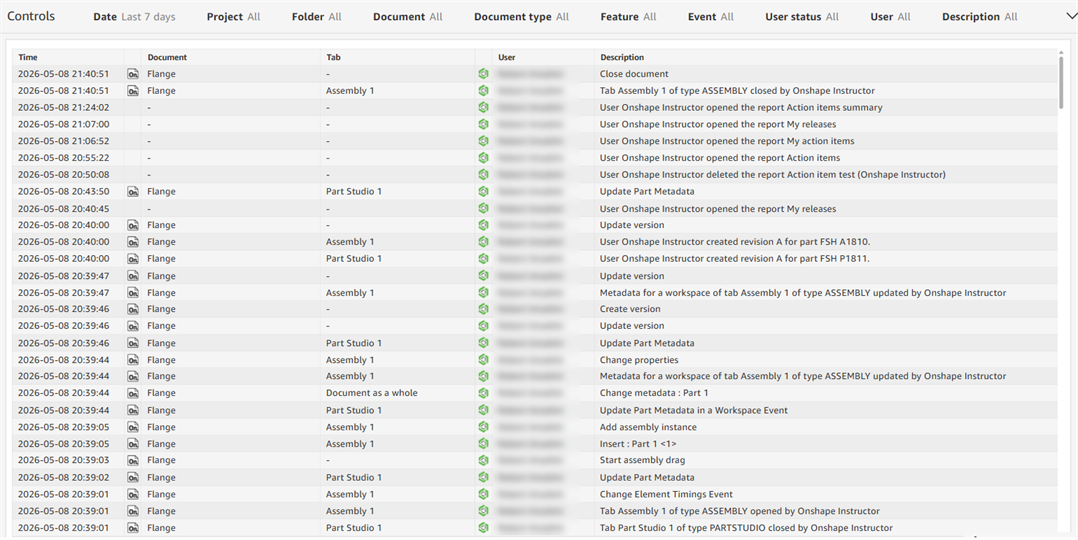
Filter controls
-
Date - The date, date range, or period of time in which to search
-
Project - Project name
-
Folder - Folder in which the document is located
-
Document - Document name
-
Feature - Feature name
-
Event - Document event, for example: Adding a Part Studio or Assembly feature
-
User Status - Admin, Member, or Guest
-
User - User email address
-
Description - Event description that can be searched by string value
-
Team - Team name
-
Active - Whether the user is active; Yes or No
Visual columns
- Time - Time the event occurred
- Document - Name of the document
- Tab - Document tab; for example, Part Studio or Assembly
- User - Name of the user involved in the event
- Description - Brief event description
This dashboard helps keep track of all the enterprise health and performance data.
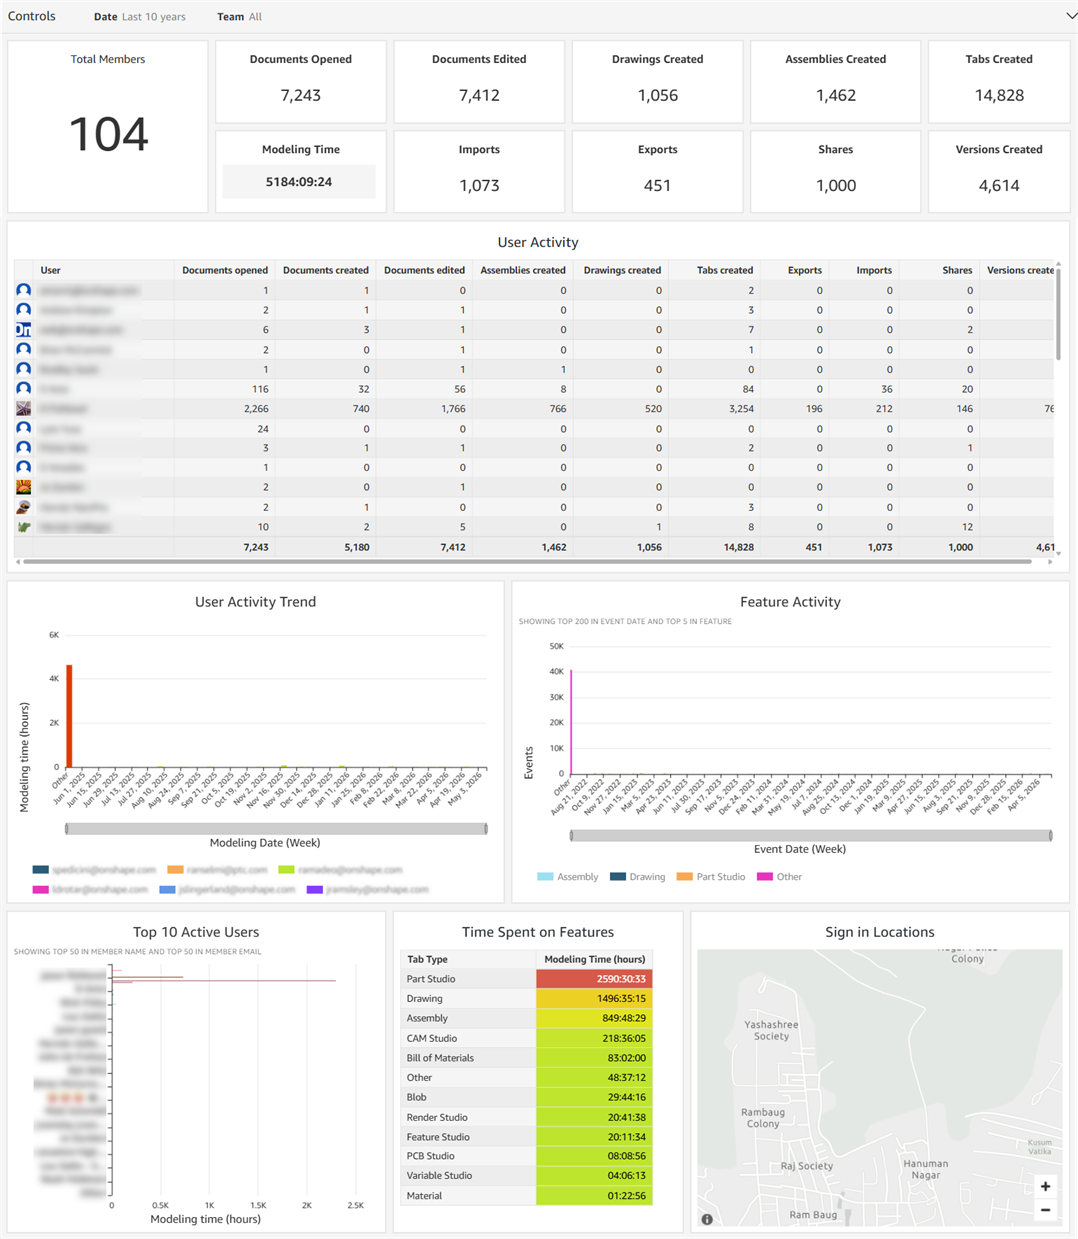
Filter controls
-
Date - Date, date range, or period of time in which to search
-
Team - Team name
Visuals
-
Total members - Count visual displaying number of members in the enterprise
-
Documents Opened - Count visual displaying number of documents opened
-
Documents Edited - Count visual displaying number of documents edited
-
Drawings Created - Count visual displaying number of drawings created
-
Assemblies Created - Count visual displaying number of assemblies created
-
Tabs Created - Count visual displaying number of tabs created
-
Modeling Time - Count visual displaying amount of time spent modeling, in hours
-
Imports - Count visual displaying number of import operations
-
Exports - Count visual displaying number of export operations
-
Shares - Count visual displaying number of times the documents were shared
-
Versions Created - Count visual displaying number of times document versions were created
-
User Activity - Table visual displaying activity by User and their individual counts of Documents opened, Documents created, Documents edited, Assemblies created, Drawings created, Tabs created, Exports, Imports, Shares, and Versions created.
-
User Activity Trend - Vertical bar chart visual displaying time each user spent modeling
-
Feature Activity - Vertical bar chart visual displaying feature activity for all Assemblies, Drawings, and Part Studios
-
Top 10 Active Users - Horizontal bar chart visual displaying top 10 most active users and their time spent modeling
-
Time Spent on Features - Table visual displaying features by tab type and the amount of time spent working on them
-
Sign in Locations - Map visual displaying all user sign in locations
This dashboard tracks intellectual property (IP) by identifying all document exports, transfers, copies, and access locations.
![]()
Filter controls
-
Date - Date, date range, or period of time in which to search
-
Document - Document name
-
Document type - Document or Publication
-
User - User email address
-
Project - Project name
-
User Status - Admin, Guest, or Member
-
User ID - User ID value
Visuals
- Documents copied - Count visual displaying number of documents copied, including the source document name and the destination document names for copy workspace events, including Public documents
- Documents exported - Count visual displaying number of documents exported
- Link shared documents - Count visual displaying number of documents that have been shared via linked sharing
- Documents Transferred - Count visual displaying number of documents transferred.
- Failed sign in - Count visual displaying number of users that fail sign in.
- Users exports - Count visual displaying number of users who have exported documents
- Users copying - Count visual displaying number of users who have copied documents
- Documents Copied - Table visual displaying every copy event (for example, copying a workspace, version, and change) of a document. If a document is copied twice, for example, there are 2 table entries.
- Document Exports - Table visual displaying every export event of a document. If a document is exported twice, for example, there are 2 table entries.
- Documents Transferred Details - Table visual displaying every document transfer event and details about the transfer, such as Document name, Event date, who the document was transferred by, who the document was transferred to, and new owner type.
- Access Locations - Map visual displaying the general locations of document opening actions
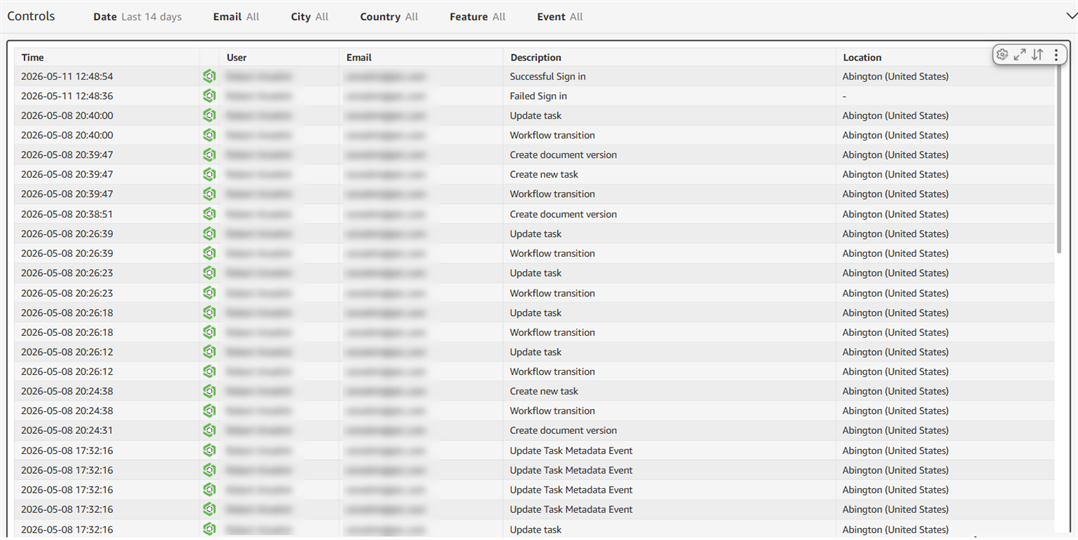
This dashboard This dashboard contains a single table visual that displays a list of user-initiated events that are not related to any document.
Filter controls
-
Date - Date, date range, or period of time in which to search
-
Email - User email address
-
City - User city
-
Country - User country
-
Feature - Name of the feature in the enterprise
-
Event - Name of the user event, for example: Add email to user account or Add member to Team Event
Visual columns
- Time - Time the activity took place
- User - Name of the user who initiated the action
- Email - User email address
- Description - Brief description of the event initiated by the user
- Location - Location from which the event was initiated