![]()
リソースダッシュボードは、ドキュメントとモデリングのアクティビティに関する日次および詳細な情報を提供します。
ダッシュボードに変更を加えた場合 (フィルターを編集したり、カスタマイズした場合)、これらの変更は新しいダッシュボードに保存できます。詳しくは、ダッシュボードの保存を参照してください。
ダッシュボードのビジュアルデータをエクスポートするには、ビジュアルデータを CSV または Excel ファイルにエクスポートするを参照してください。
さらに詳しくは、アナリティクスダッシュボードの操作とアナリティクスダッシュボードのビジュアルの操作を参照してください。
左側のドキュメントパネルからアナリティクス (![]() ) をクリックします。次に、アナリティクスナビゲーションパネルにあるリソースフィルターをクリックします。
) をクリックします。次に、アナリティクスナビゲーションパネルにあるリソースフィルターをクリックします。
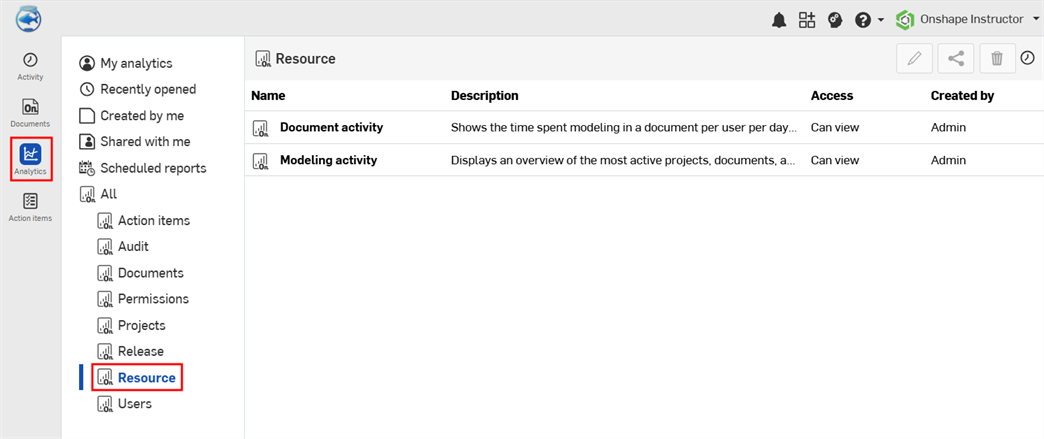
既定のリソースダッシュボード
-
ドキュメントアクティビティ - 特定の期間にユーザーがドキュメントのモデリングに費やした時間を表示します。
-
モデリングアクティビティ - 特定の期間に最もアクティブだったプロジェクト、ドキュメント、ユーザーの概要を表示します。
このダッシュボードには、特定の期間にユーザーがドキュメントのモデリングに費やした時間を表示する単一のテーブルが表示されます。
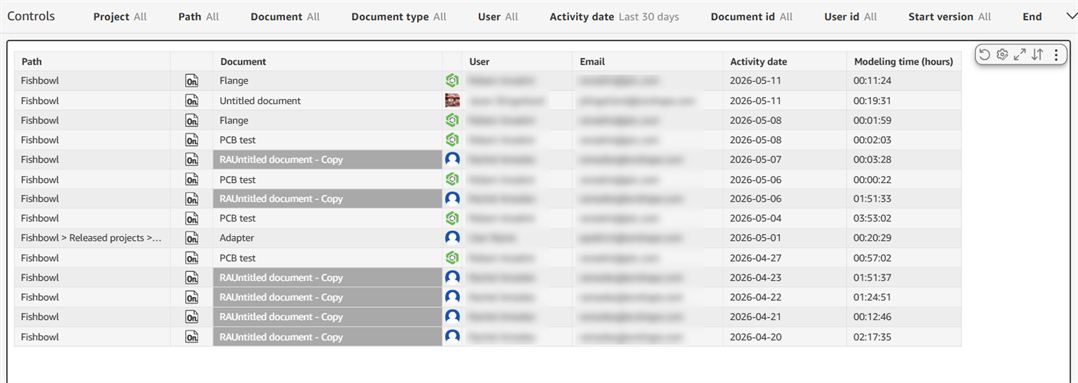
フィルターコントロール
-
プロジェクト - プロジェクト名
-
パス - ドキュメントフォルダのパス
-
ドキュメント - ドキュメント名
-
ドキュメントタイプ - ドキュメントまたはパブリケーション
-
ユーザー - ユーザーのメールアドレス
-
アクティビティの日付 - ドキュメントアクティビティを検索する日付、日付範囲、または期間
-
ドキュメント ID - ドキュメントの ID の値
-
ユーザー ID - ユーザー ID の値
-
開始バージョン - ドキュメントの開始バージョン。
-
終了バージョン - ドキュメントの終了バージョン
開始と終了のバージョンフィルターを使用すると、同じドキュメントの特定のバージョン間のモデリング時間を表示できます。
ビジュアル列
- パス - ドキュメントフォルダのパス
- ドキュメント - ドキュメント名
- ユーザー - ユーザー名
- メールアドレス - ユーザーのメールアドレス
- アクティビティの日付 - モデリングアクティビティが行われた日付
- モデリング時間 - ユーザーがドキュメントでモデリングに費やした時間数。
このダッシュボードは、特定の期間で最もアクティブだったプロジェクト、ドキュメント、ユーザーの概要を表示します。
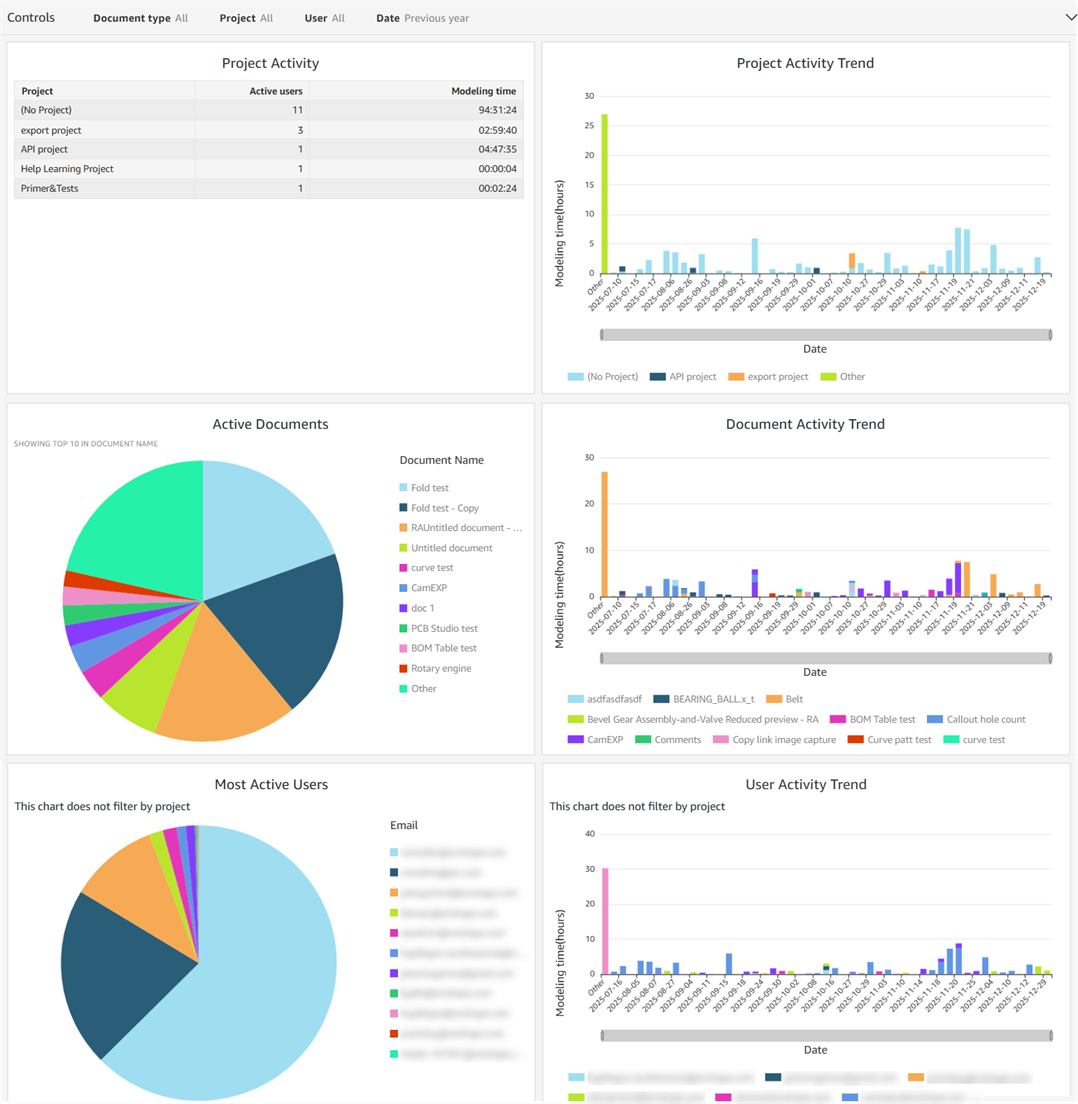
フィルター
-
ドキュメントタイプ - ドキュメントまたはパブリケーション
-
プロジェクト - プロジェクト名
-
ユーザー - ユーザーのメールアドレス
-
日付 - モデリングアクティビティを検索する日付、日付範囲、または期間
ビジュアル
- プロジェクトアクティビティ - アクティブユーザーの数およびプロジェクトごとのモデリング時間の合計を表示するテーブルビジュアル。(プロジェクトなし) の列には、プロジェクトに含まれていないすべてのドキュメントの情報が表示されます。
- プロジェクトアクティビティの傾向 - プロジェクトごとに、モデリング時間 (Y 軸) と日付 (X 軸) を表示する縦棒グラフのビジュアル
- アクティブなドキュメント - アクティブなドキュメントごとにモデリングに費やした時間の割合を表示する円グラフのビジュアル
- ドキュメントアクティビティの傾向 - ドキュメントごとに、モデリング時間 (Y 軸) と日付 (X 軸) を表示する縦棒グラフのビジュアル
- 最もアクティブなユーザー - 各ユーザーがモデリングに費やした時間の割合を表示する円グラフのビジュアル
- ユーザーアクティビティの傾向 - ユーザーごとに、モデリング時間 (Y 軸) と日付 (X 軸) を表示する縦棒グラフのビジュアル。