![]()
![]()
![]()
ダッシュボードのビジュアルは、カウント、テーブル、グラフ (棒、円、ドーナツ)、またはマップで構成されるダッシュボードのコンポーネント (タイルと呼ばれることもあります) です。各ダッシュボードには、1 つまたは複数のビジュアルを含めることができます。ビジュアルには共通のコントロールセットがあります。ビジュアルデータは、表示、カスタマイズ、追加、削除、並べ替え、エクスポートができます。
ビジュアルのデータをカスタマイズするには、次の操作を行います。
-
ビジュアルの右上隅にあるカスタマイズアイコン (
 ) をクリックします。
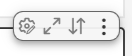
-
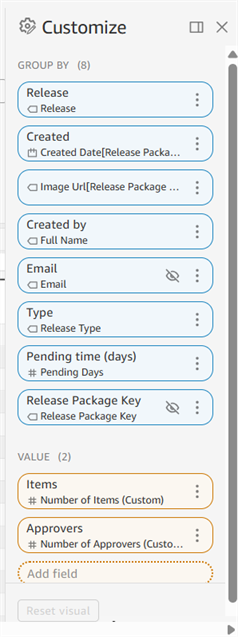
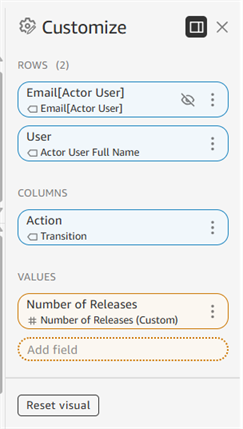
右側のパネルが開き、[グループ別] または [行] と [列] のデータ (青) と [値] (オレンジ) がすべて表示されます。フィールドは各カスタマイズカテゴリの下にリストされます。
-
フィールド内のオーバーフローメニューをクリックすると、次のオプションが表示されます。フィールドによっては、利用できないオプションもあります。
-
並び順 - 主にビジュアルを並べ替えるグループ。
-
並べ替え順 - 昇順または降順
-
集計 - データの集計方法: 秒、分、時間、日、週、月、四半期、年。
-
表示形式 - 数値、通貨、パーセント。
-
形式 - 数値形式 (カンマと小数点の有無)。
-
非表示 - 現在のグループ、行、または列を非表示にします
-
非表示のフィールドをすべて表示 - 非表示に設定されているフィールドがあれば、すべて表示されます。
-
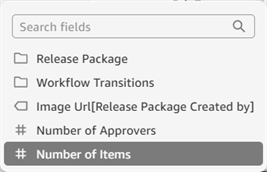
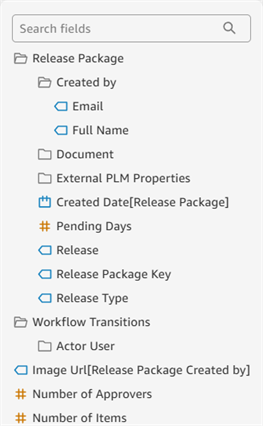
置換 - 現在のフィールドを別のフィールドに置換します。このリストが長い場合は、検索ボックスを使用してフィールドを探してください。
-
削除 - 現在のグループ、行、または列を削除します。
-
-
カスタマイズパネルの下部にある [ビジュアルをリセット] ボタンをクリックすると、すべてのカスタマイズが既定値に戻ります。または、ビジュアルの右上隅にある元の表示にリセットアイコン (
 ) をクリックして、ビジュアルビューを既定に戻します。
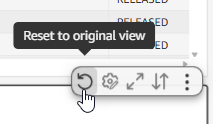
-
カスタマイズパネルの下部にある [フィールドを追加] オプションをクリックして検索し、ビジュアルに新しいフィールドを追加します。
ビジュアルの右上隅にある最大化/最小化アイコン (![]() /
/![]() ) をクリックして、ビジュアルを画面の幅全体に表示する (最大化) か、元のサイズに縮小します (最小化)。
) をクリックして、ビジュアルを画面の幅全体に表示する (最大化) か、元のサイズに縮小します (最小化)。
ビジュアルがすでに画面の幅と同じ場合は、最大化しても効果はありません。
現在のビジュアルのデータを並べ替えるには、次の操作を行います。
-
ビジュアルの右上隅にあるビジュアルの並べ替えアイコン (
 ) をクリックします。
-
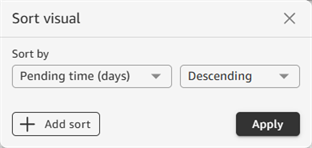
ビジュアルの並べ替えダイアログが開きます。[並べ替え] ドロップダウンをクリックして、テーブルデータを並べ替える列を選択し、右側のドロップダウンを使用して並べ替えを昇順にするか降順にするかを指定します。
-
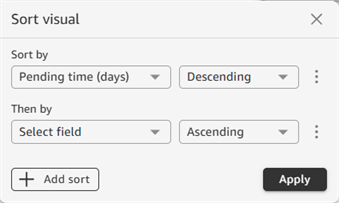
リストに二次ソートを追加するには、[並べ替えを追加] ボタンをクリックします。さらにソートを追加して、テーブルの並べ替えをさらに調整できます。
-
終了したら、[適用] ボタンをクリックします。
テーブルビジュアルは CSV または Excel ファイルにエクスポートできます。カウント、グラフ、マップのビジュアルデータは CSV ファイルにのみエクスポートできます。ビジュアルデータをエクスポートするには、次の操作を行います。
-
ビジュアルの右上隅にあるオーバーフローアイコン (
 ) をクリックします。
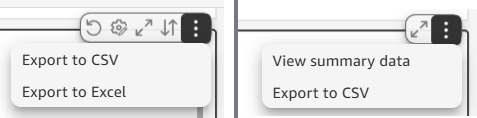
テーブルビジュアル (左) とグラフビジュアル (右) のオーバーフローメニュー
-
[CSV にエクスポート] または [Excel にエクスポート] をクリックします。
-
ファイルが作成され、接続しているデバイスにダウンロードされます。ファイルの作成中であることを示すメッセージ (CSV/Excel ファイルの生成中) が表示されます。また、ファイルがダウンロードされた際に別のメッセージ (CSV/Excel の準備完了) が表示されます。X をクリックしてこれらのメッセージを閉じます。
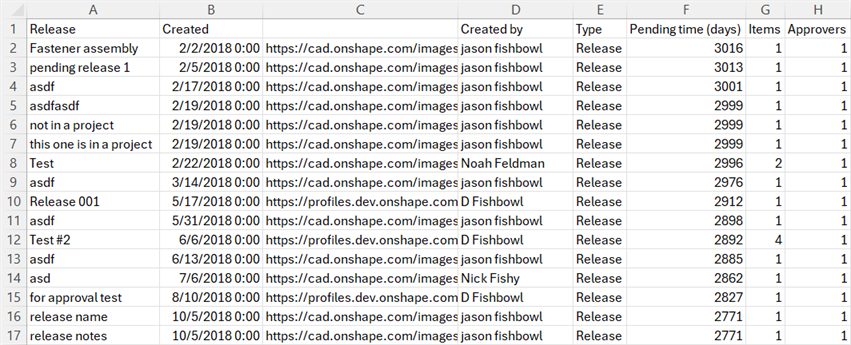
CSV のエクスポートを Microsoft Excel で開いた例
CSV または Excel ファイルでエクスポートすると、完全なデータセットが送信され、テーブルのページ区切りの設定による影響はありません。エクスポートの制限についての説明は、ビジュアルからのデータのエクスポートを参照してください。
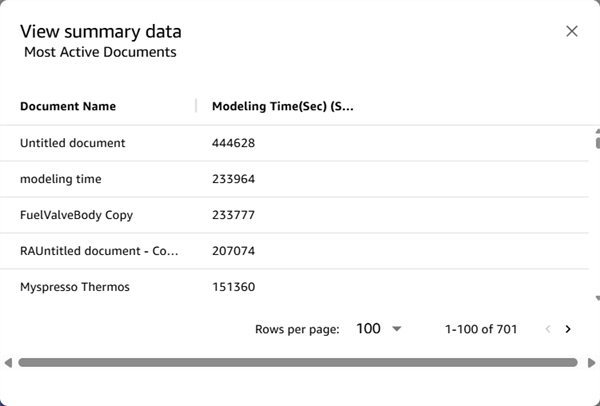
概要データを表示すると、グラフやマップのビジュアルデータがテーブルに変換され、モーダルダイアログで表示されます。概要データを表示するには、次の操作を行います。
-
ビジュアルの右上隅にあるオーバーフローアイコン (
) をクリックし、[概要データを表示] を選択します。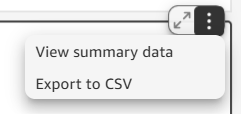
-
データはモーダルダイアログで開き、次のアクションを実行できます。
-
データをそれぞれ下端と右端に沿って水平または垂直にスクロールします。
-
列の見出しをクリックすると、この列を基準にデータを昇順または降順に並べ替えます。
-
[1 ページあたりの行数] ドロップダウン矢印をクリックして、1 ページに表示するエントリ数 (25、50、または 100) を選択します。
-
ページ間を移動するには、右下隅のページ行数の右側にある前のページ / 次のページの矢印をクリックします。
-
カウントビジュアルには、単一の集計データ値が表示されます。これは、合計数 (例: 合計人数や開いているドキュメントの合計数) や、時間枠 (例: モデリング時間) などがあります。
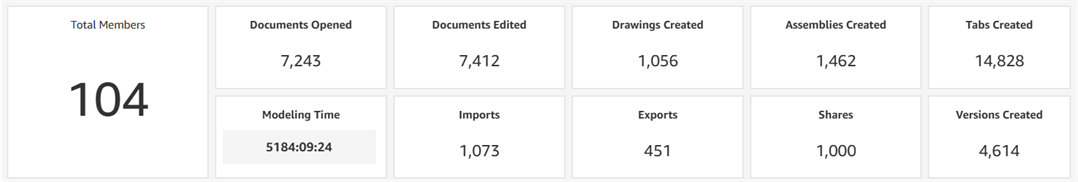
監査 > Enterprise ヘルスダッシュボードのカウントビジュアルの例。
ダッシュボードでカウントビジュアルが使用されている場合、通常は他のダッシュボードのビジュアルよりも先に最上部に表示されます。
テーブルは最も一般的なダッシュボードのビジュアルタイプで、行と列にデータを表示します。
テーブルデータのカスタマイズ
テーブルの列見出しをクリックすると、コンテキストメニューが開き、基になるテーブルデータをさらにカスタマイズできます。これらのオプションの一部は、カスタマイズパネルでも利用できます。フィールドによっては、利用できないオプションもあります。
- 並び順 - 主にビジュアルを並べ替えるグループ。
-
並べ替え順 - 昇順または降順
-
集計 - データの集計方法: 秒、分、時間、日、週、月、四半期、年。
-
表示形式 - 数値、通貨、パーセント。
-
形式 - 数値形式 (カンマと小数点の有無)。
-
非表示 - 現在のグループ、行、または列を非表示にします
-
非表示のフィールドをすべて表示 - 非表示に設定されているフィールドがあれば、すべて表示されます。
-
左に移動 - 現在の列を左に移動します
-
右に移動 - 現在の列を右に移動します
-
列を固定 - テーブルの左側にある列を固定し、テーブルを横にスクロールしても元の位置に留まるようにします。
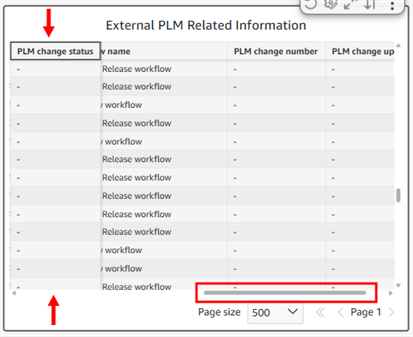
例: "PLM 変更ステータス" 列を固定すると、水平のスクロールバーを移動しても、この列は動きません。
-
この列まで固定 - 現在の列を含め、左側のすべての列を固定します。
-
置換 - 現在のフィールドを別のフィールドに置換します。このリストが長い場合は、検索ボックスを使用してフィールドを探してください。
-
削除 - 現在のグループ、行、または列を削除します。
-
カスタマイズ - カスタマイズパネルを開きます。
-
ビジュアルをリセット - すべてのカスタマイズを既定値に戻します。または、ビジュアルの右上隅にある元の表示にリセットアイコン (
) をクリックして、ビジュアルビューを既定に戻します。
すべての列がビジュアルの幅で表示されている場合は、固定しても効果はありません。
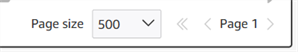
テーブルのページ区切り
テーブルによっては、ページサイズとページ番号がビジュアルの右下隅に表示されます。既定では、ビジュアルの最初の 500 個のテーブルエントリが表示されます。
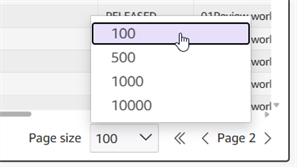
ページサイズは、1 ページあたり 100、500、1,000、または 10,000 エントリを表示するように調整できます。ドロップダウン矢印をクリックして、1 ページに表示するエントリ数を選択します。右または左のページ番号の矢印をクリックして、それぞれ次のページまたは前のページに移動します。
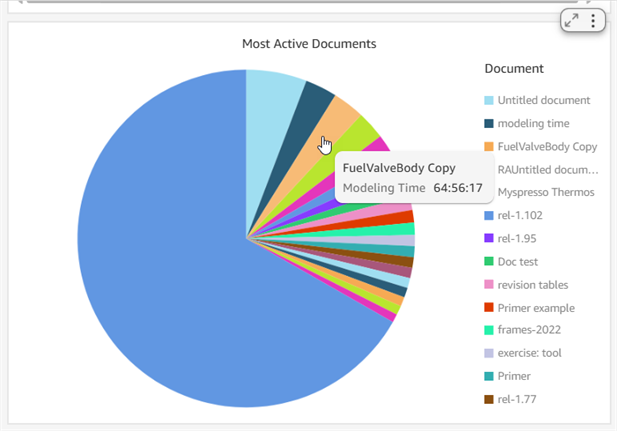
円グラフ
円グラフのセグメントにカーソルを合わせると、詳細情報が表示されます。
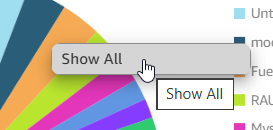
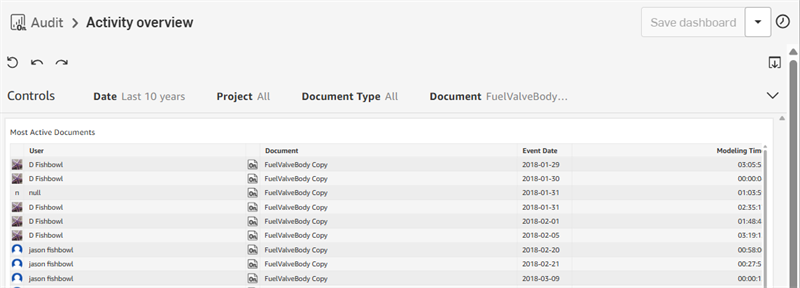
任意のセグメントをクリックして、[すべて表示] をクリックします (下の最初の画像)。これにより、そのセグメントのデータがテーブル形式で開きます (下の 2 番目の画像)。
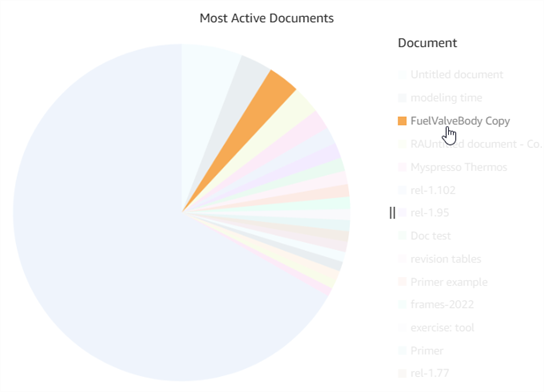
セグメントの凡例エントリをクリックすると、そのセグメントだけが円グラフに表示され、他のセグメントはすべて淡色で表示されます。
区切り線 (![]() ) をクリックしてドラッグし、円グラフと凡例の間の間隔を調整します。
) をクリックしてドラッグし、円グラフと凡例の間の間隔を調整します。
棒グラフ
縦棒グラフまたは横棒グラフは円グラフと同じように機能しますが、棒をクリックしても他のデータは淡色にはなりません。棒の上にカーソルを合わせると、棒のデータが表示されます。棒をクリックすると、追加のオプションを含むコンテキストメニューが表示され、棒のデータをさらに詳しく調べることができます。
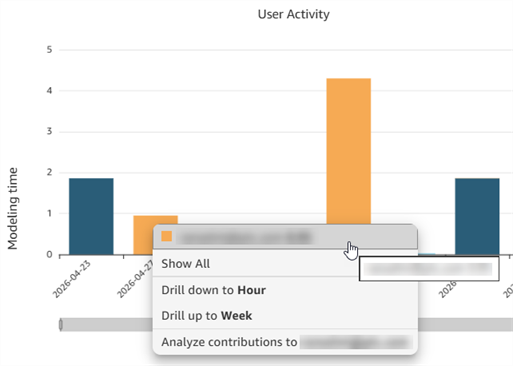
ユーザーアクティビティの棒グラフと追加オプション。
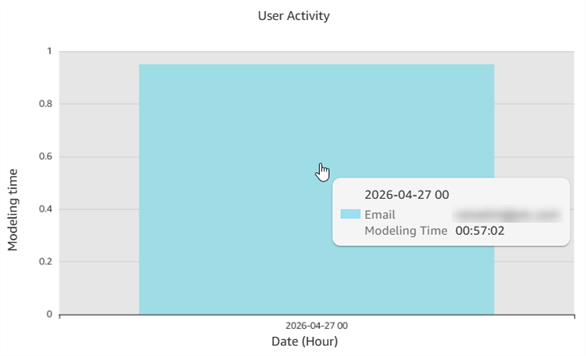
[時間にドリルダウン] をクリックすると、時間単位のデータにズームします。
表形式のデータと同様にすべてを表示したり、現在の棒の影響を分析する追加オプションがあります。
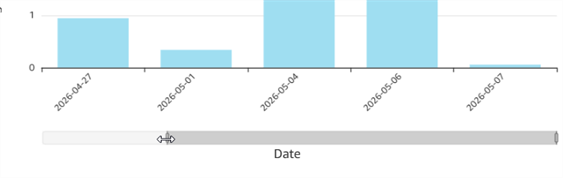
X 軸データの棒のいずれかの端からドラッグして、グラフに表示される範囲を調整します。たとえば、次の棒グラフでは日付範囲を調整しています。
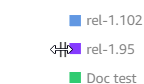
区切り線 (![]() ) をクリックしてドラッグし、棒グラフと凡例の間の間隔を調整します。
) をクリックしてドラッグし、棒グラフと凡例の間の間隔を調整します。
ドーナツグラフ
ドーナツグラフは円グラフに似ていますが、ドーナツの形をしたリングとしてデータが表示される点が異なります。中央にはデータの合計が表示され、セクションデータはリングに表示されます。リングのセグメントにカーソルを合わせると、以下のようにそのリングのセグメントのカウントが表示されます。
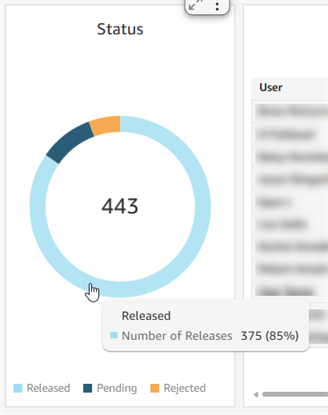
ステータス数の合計が 443 (中央)、リリース数が 375 (青いセグメント) のドーナツチャートの例
マップビジュアルは、世界地図を使用して場所データを表示します。クリックアンドドラッグして地図の位置を変更すると、特定の地域にアクセスできます。拡大/縮小するには、マップ上の +/- ズームアイコンを使います。
マップビジュアルは現在、Onshape Government (米国) のサブスクリプションでは使用できません。
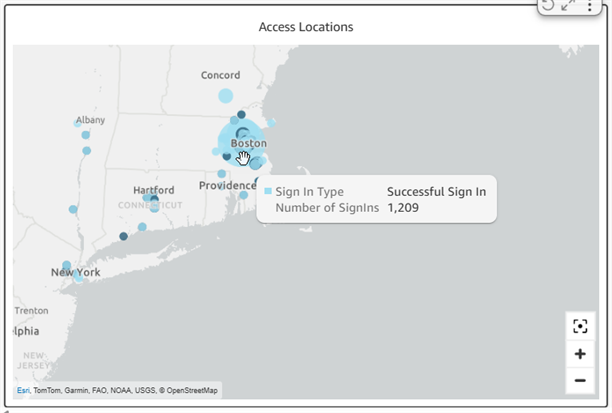
マップ上の点にカーソルを合わせる
マップ上の点をクリックすると、その場所のアクティビティに関する情報が表示されます。情報をクリックすると、より詳細な情報が記載されたパネルが開きます。たとえば、下の「失敗したサインインを表示」をクリックすると、サインイン情報と、国、都市、イベントの日付、IP アドレス、セッション ID、ユーザーの列を含む新しいテーブル形式のダッシュボードが開きます。
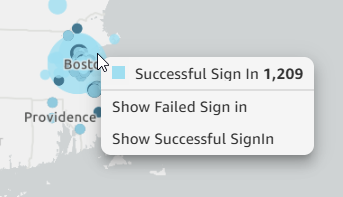
マップ上の点をクリックすると、追加のダッシュボードにアクセスできます。