![]()
Der Projekte-Filter umfasst ein Projektlisten-Dashboard, das alle Projekte im Enterprise und ihre zusammenfassenden Informationen anzeigt.
Wenn Änderungen an einem Dashboard vorgenommen werden (Filter werden bearbeitet oder Anpassungen vorgenommen), können diese Änderungen in einem neuen Dashboard gespeichert werden. Weitere Informationen finden Sie unter Dashboard speichern.
Um Daten für eine Dashboard-Grafik zu exportieren, siehe Visuelle Daten als CSV- oder Excel-Datei exportieren.
Weitere Informationen finden Sie unter Arbeiten mit Analytik-Dashboards und Arbeiten mit Analytik-Dashboard-Grafiken.
Klicken Sie links im Dokumentbereich auf „Analysen“ (![]() ). Klicken Sie dann in der Analysen-Navigationspalette auf den Filter Projekte:
). Klicken Sie dann in der Analysen-Navigationspalette auf den Filter Projekte:
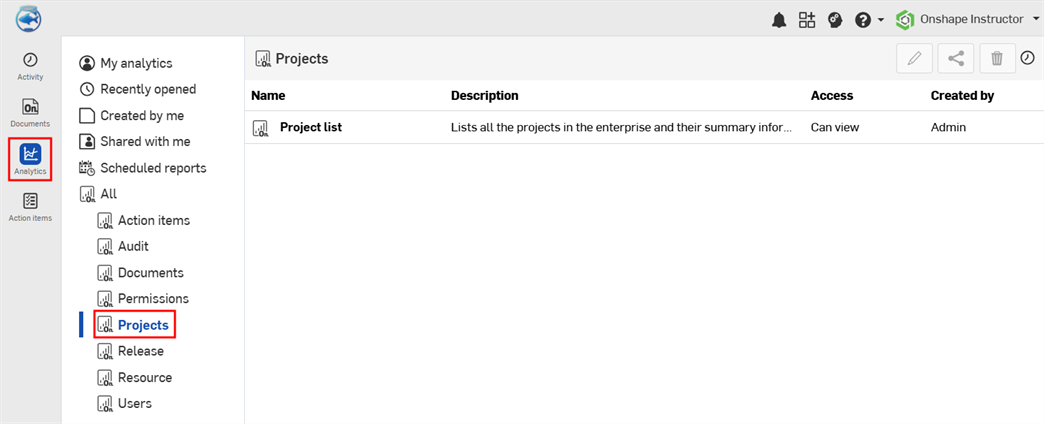
Standard-Dashboard für Projekte
-
Projektliste: eine Liste aller Projekte im Enterprise und deren zusammenfassende Informationen.
Dieses Dashboard enthält eine einzige Tabelle, die alle Projekte im Enterprise und ihre zusammenfassenden Informationen auflistet.
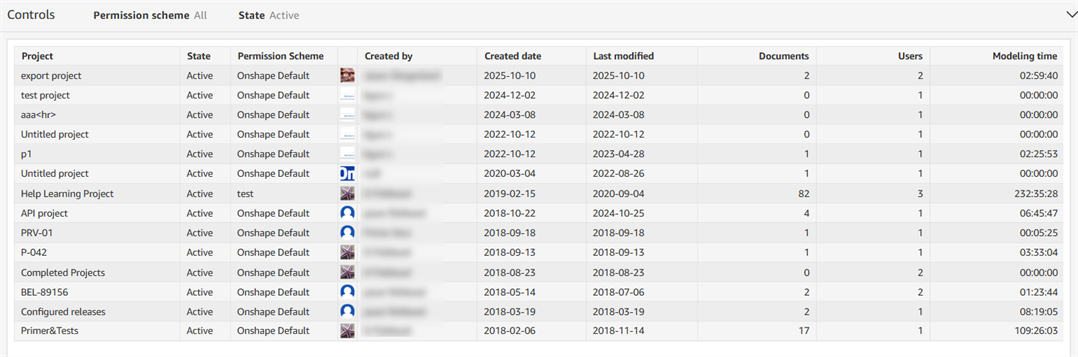
Filtersteuerungen
-
Berechtigungsplan: ein Plan mit Berechtigungen für den Projektzugriff, z. B.Onshape-Standard oder Allgemeiner Benutzer
-
Status: der Status des Dokuments – Aktiv, Gelöscht oder In den Papierkorb verschoben
Visuelle Spalten
- Projekt: Name des Projekts
- Status: der Status des Dokuments – Aktiv, Gelöscht oder In den Papierkorb verschoben
- Berechtigungsplan: ein Plan mit Berechtigungen für den Projektzugriff, z. B.Onshape-Standard oder Allgemeiner Benutzer
- Erstellt von: der Name des Benutzer, der das Objekt erstellt hat
- Erstellt: das Datum der Projekterstellung
- Letzte Änderung: das Datum, an dem das Projekt zuletzt geändert wurde
- Dokumente: die Anzahl der Dokumente im Projekt
- Benutzer: die Anzahl der Benutzer mit Dokumentberechtigung
- Modellierungszeit (Stunden): der Zeitaufwand für Projektmodellierungen (alle Benutzer, für alle Dokumente im Projekt)