Debugging in Feature Studios
When creating and editing custom features, it's important to have continuous feedback about what your feature is doing, and, often, why it's breaking. This feedback comes from two sources: FeatureScript analysis, which gives static information, and FeatureScript execution, which gives runtime information.
FeatureScript analysis
Analysis is run as you type in any Feature Studio in Onshape. It serves to statically process FeatureScript before it is executed, and provides inline feedback including:
- Parse errors for code that does not match FeatureScript's grammar
- Semantic warnings for e.g. a variable or function call name that doesn't match anything visibly defined
- Precondition analysis warnings for a feature precondition that doesn't properly specify the feature UI
- Documentation extracted from source comments and shown when hovering on symbols


NOTE
Analysis is run on FeatureScript without waiting for a commit. This means analysis information relates to the current text in a Feature Studio, not the committed version.
FeatureScript execution
Execution, or "running" FeatureScript code, always begins in a Part Studio. As described in Defining feature types, modifying a Part Studio causes the changed feature, and everything after it, to be executed again (or "regenerated"). Committing a change to a custom feature's code and looking at a Part Studio which uses that feature will also trigger regeneration.
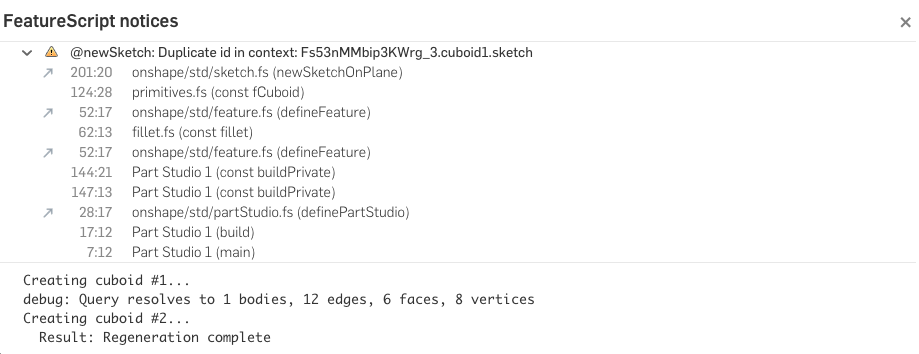
Feedback from FeatureScript execution can greatly aid debugging and includes:
- Printed output from functions like
print,println,printTimer, anddebug - Language runtime exceptions like dereferencing
undefinedor dividing by zero - Thrown exceptions (including regenErrors, which appear as infos)
NOTE
Execution only happens on committed code. This means execution information always relates to the committed version of a Feature Studio, not the current text.
The execution information can be seen in the notices pane after switching to the Part Studio's Onshape tab (or opening it in a new browser tab). However, to see the information directly in a Feature Studio, and see it update as you're editing, you will first need to monitor a Part Studio.
Monitoring execution information
You can begin monitoring a Part Studio's execution either by selecting "Monitor [Part Studio name]" in the Feature Studio's toolbar, or by selecting "Monitor" next to a Part Studio's notices in the notices pane.
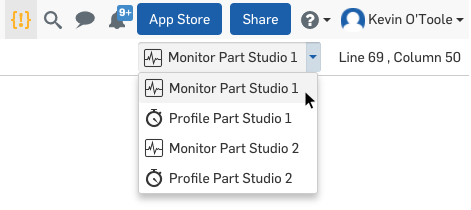

A monitored Part Studio will be re-executed every time the code of a custom feature it uses is committed. The execution information will then appear in the Feature Studios whose code is executed:


Type checking
Additionally, when monitoring, execution checks that values with type tags in the code conform to their typechecks. Any failures from the typecheck are reported as warnings. To improve performance during ordinary modelling, these typechecks only ever run on monitored Part Studios.
With monitor mode's typechecking, the flow of execution does not change. For example, errors thrown in a typecheck in monitor mode will be shown in the notices panel, but execution will continue as normal, and overall feature error status will not be set.
Profiling regeneration timings
Decreasing the regeneration time of your custom features is an important part of improving the end user's experience. Fortunately, FeatureScript's design allows Onshape to determine, at a high resolution, which pieces of code (divided into execution steps) are responsible for what portion of execution time.
You can view timing data for individual execution steps of a regeneration by profiling a Part Studio. Like monitoring, profiling can be started on any Part Studio, and will update its results whenever code changes are committed.
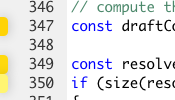
Profiling will put hoverable markers on the left-hand side of the code lines your Feature Studio, containing the timings of all steps whose execution took longer than 0.1ms.
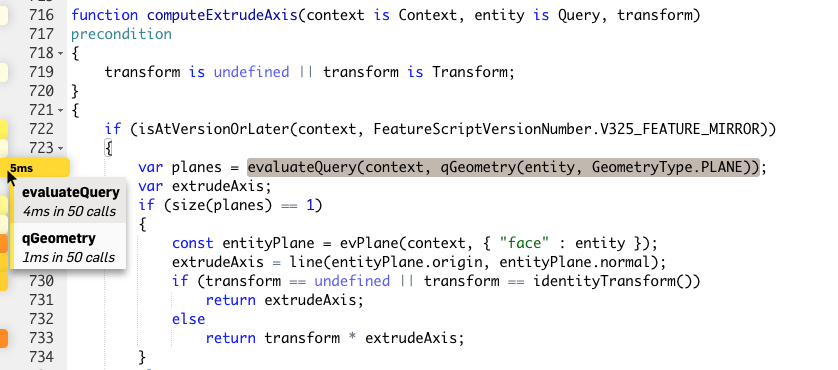
These markers tell you how many times the code for each step is called, and the total time taken across all those calls. The markers are colored according to the total time for that step relative to the regeneration time of the whole Part Studio (darker, redder colors indicate more time, and lighter, yellower colors indicate less time).
Additionally, a marker in the upper-left corner shows the total time taken for the full Part Studio to regenerate. Hovering on it will show a sorted list of the longest steps from the current Feature Studio.
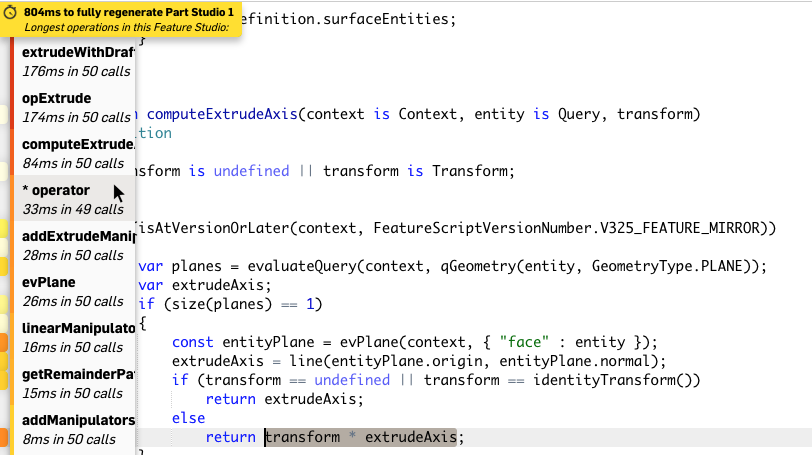
Just like when monitoring, the profile data updates automatically when you commit changes to a Feature Studio used by the profiled Part Studio.
Profiling tips
A few things to keep in mind while examining your profiling data:
There will always be variability in timings. Timings for individual steps and for the full Part Studio will change slightly up or down between executions for reasons that have nothing to do with code changes.
However, simply switching between Feature Studios in the same document will show timing data from the same full regeneration in each tab.
If you look at a Feature Studio which was never executed as part of the profiled Part Studio's regeneration, the top-left marker will show the message below. If you were expecting this code to be executed, make sure the relevant custom feature has been created (and confirmed) in the profiled Part Studio.

The total time in the top left marker represents the time taken to execute the entire Part Studio, including execution of non-custom features. If you include multiple instances of the same feature in a profiled Part Studio, the timings will include calls from all instances of the feature.
Only code which is actually executed will have associated timing data, so, for instance, a branch of an if statement not taken for a certain Part Studio will not yield any timing data.
If your custom feature behaves very differently with different input parameters, we recommend creating a few Part Studios with different use cases, and profiling each of them in turn.
Throwing an exception or a regeneration error will cause successive code to not run. If you see your profiling times improving drastically, make sure to check that you haven't simply thrown a runtime error that prevents further execution.
When calling functions defined in the current Feature Studio, profiling will give data for both the full function call (displayed at the call site), and for the steps inside the function (displayed in the function definition). In this case, the total time taken by one Feature Studio will not be a linear sum of all its profiling data (since that would count the inner execution steps twice).
A profiled step can be any node in the FeatureScript's abstract syntax tree, and the timings represent the total time taken by the FeatureScript interpreter to execute that node. Usually, a node which takes significant time will be a function call, or an operator like
+or*, but occasionally more obscure nodes like variable assignments or large map literals will show up with timings in the profile data.
Filtering the notices pane
You can filter which notices appear in the notices pane. Click the filter icon, select a search option, and then type your search term.
You can filter notices by:
- :text = Filter by notice text
- :elementid = Filter by element ID
- :tabname = Only show notices for tab names that match the search string
- :currenttab = Only show notices for the current tab
- :minlevel = Filter by severity level:
info | warn | error
Tips:
- Use quotation marks to match a search term exactly. For example,
:tabname part studio 1will display notices for Part Studio 1, Part Studio 10, Part Studio 11, etc.:tabname "part studio 1"will only display notices for Part Studio 1. - Searches are not case sensitive.
- Filters can be combined. For example
:tabname "part studio 2" :minlevel errorwill display only error notices for Part Studio 2.
Importing modules
Importing unnecessary modules can decrease overall performance.
Open the Performance panel in your Feature Studio to view the number of total imported modules. A warning symbol indicates that more than 600 modules have been imported, and performance may be impacted.
It is best practice to:
- Avoid importing more modules than necessary. For example, the
geometry.fsstandard library module includes everything in thecommon.fsmodule and more, and thus should only be used wherecommon.fsdoes not suffice. - Avoid importing multiple versions of the standard library both via Feature Studios and Part Studios.
Out of date information
When markers in the Feature Studio don't represent information from the exact current text of the full Feature Studio, they are marked out-of-date (and may be temporarily incorrect). Below, the left-hand column shows out-of-date versions of an error, a warning, and profile data. The right-hand column shows up-to-date versions of that same information.
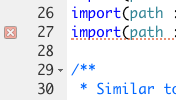

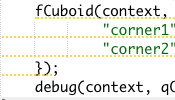
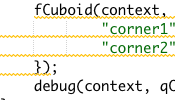
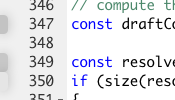
Out-of-date markers from analysis will update themselves when analysis on the latest text finishes (which should be quick). Out-of-date markers from execution will be up-to-date after the current code is committed, and execution of that code is complete.
Internal errors
Internal errors are problems within Onshape which should never happen, no matter what your FeatureScript looks like. If you see a notice reported like the one below, please contact Onshape Support through the feedback menu, or post in the FeatureScript forum.
