 分析工具
分析工具
![]()
分析工具用于检查 Part Studio 中草图边/曲面和零件边/曲面/体积的设计完整性,以及装配体中的实例曲面/干涉的设计完整性。分析工具图标显示在 Part Studio 和装配体界面的右下角。
单击“显示分析工具” (![]() ) 打开环境菜单:
) 打开环境菜单:
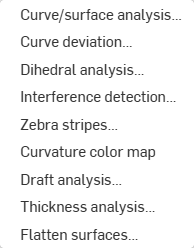
对于所有分析工具,当对话框重新打开时,在工具对话框中所做的选择可以是非永久的,也可以是永久的,具体取决于工具对话框的访问方式。从“分析工具”菜单 (![]() ) 中选择一个工具将打开对应的对话框但不保留先前选择项(非永久性)。使用工具的快捷方式打开其对话框将保留先前输入的选项(永久保留)。通过这种方式,用户可以选择保留或放弃之前的对话框选项。有关如何为没有快捷键的工具分配快捷键的信息,请参阅键盘快捷键和快捷键。
) 中选择一个工具将打开对应的对话框但不保留先前选择项(非永久性)。使用工具的快捷方式打开其对话框将保留先前输入的选项(永久保留)。通过这种方式,用户可以选择保留或放弃之前的对话框选项。有关如何为没有快捷键的工具分配快捷键的信息,请参阅键盘快捷键和快捷键。
快捷方式:shift+c
在 Part Studio 中使用各种方法对草图或零件进行曲率可视化和分析。通过快捷方式 (Shift+c)、草图、零件或曲面上的环境菜单或界面右下角的“显示分析”工具菜单来访问“曲线/曲面分析”对话框。
在草图模式下或编辑草图时,您可以使用快捷方式 Shift+c 自动选择所有草图曲线,并打开“曲率/曲面分析”对话框。Shift+c 作为切换开关:在仍然选中的同时,可打开和关闭对话框。
即使在退出草图之后,曲率/曲面处理工具也会保持打开状态,不过,选择输入框不会处于激活状态。您可以添加更多选择,或移除选择,只要工具处于打开状态即可。如果您在打开工具之前进行预选,则工具会打开且仅包含该选择,同时清除了先前进行的任何其他选择。
若要检查曲线和曲面,请执行以下操作:
- 单击界面右下角的“显示分析工具”图标 (
 )。
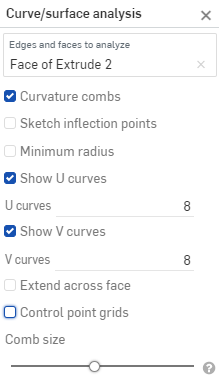
)。 - 选择曲线/曲面分析打开对话框。您也可以通过右键单击图形区域中的草图或零件并在环境菜单中选择来访问此对话框:
-
选择要分析的边和面。或者,您可以在访问对话框之前选择它们。
- 从以下选项中选择:
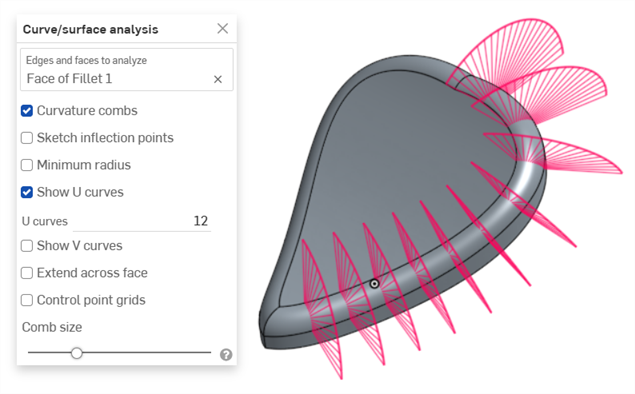
曲率梳 - 显示选定边和/或面沿 U 和 V 方向的梳理。曲率梳在均匀间隔的等值线上进行评估,不一定是在控制点,用于评估直至流动 (G3) 连续性的曲线/曲面的合成形状。
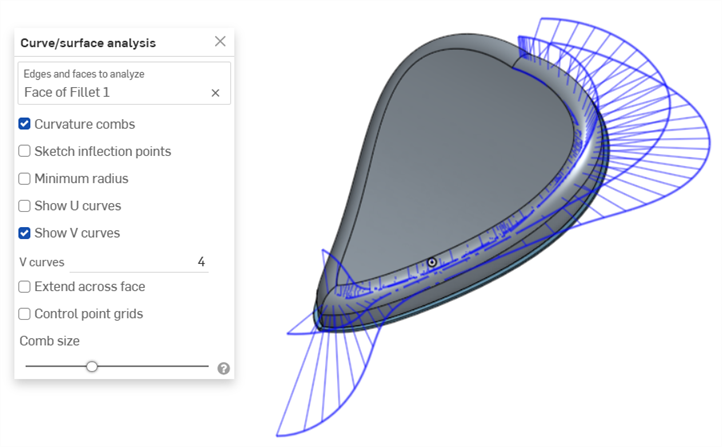
曲率沿着面的 V 方向梳理
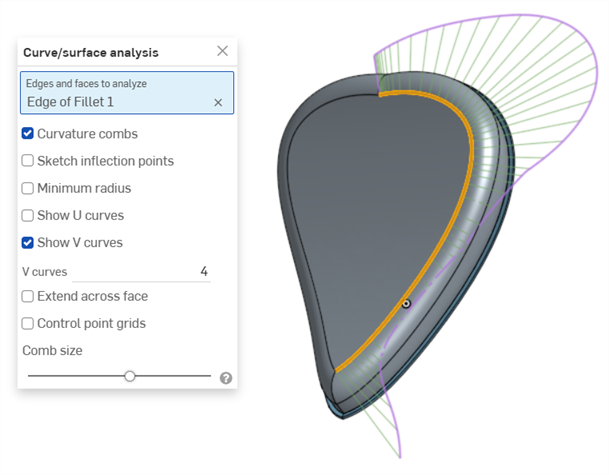
边有曲率梳。梳以绿色显示,边界为洋红色。
Show U curves - Displays curvature combs along the U direction. U curves are displayed in red:
Show V curves - Displays curvature combs along the V direction. V curves are displayed in blue:
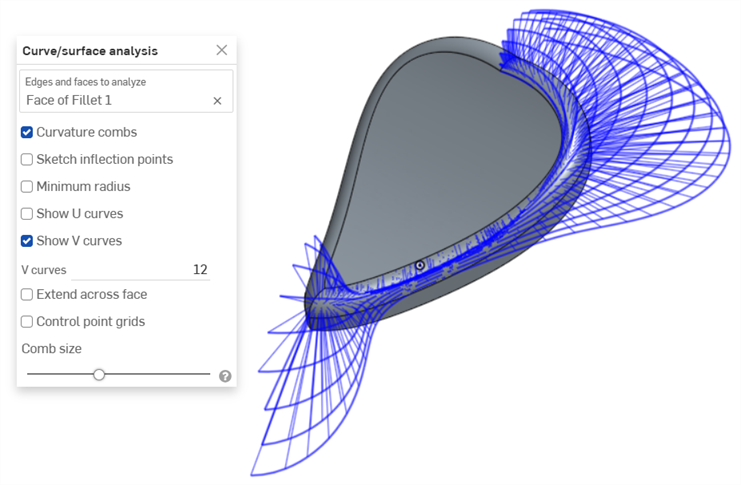
Increase or decrease the number of curves using the numeric U curves and V curves fields, from 2 to 64. The default is 8 for each.

V 曲线设置为 2(左)、4(中间)和 8(右)
Sketch inflection points (sketch only) - Displays the inflection points along a sketch edge. They appear as black 'bow ties':
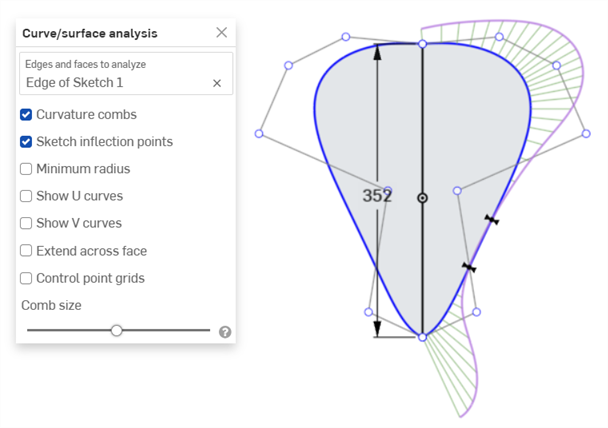
Minimum radius (edges only) - Shows the minimum radius along an edge, either a sketch or part edge:
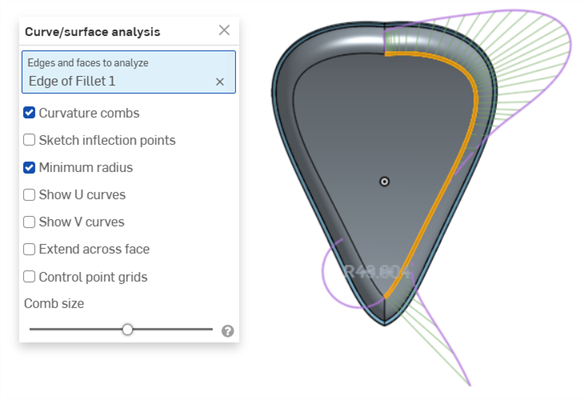
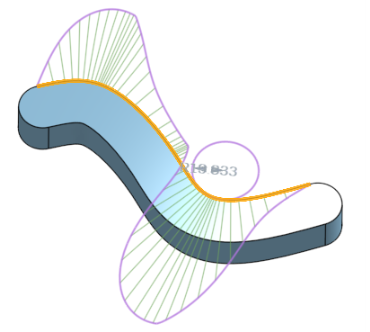
跨面延伸 - 沿相邻面延伸曲率梳:
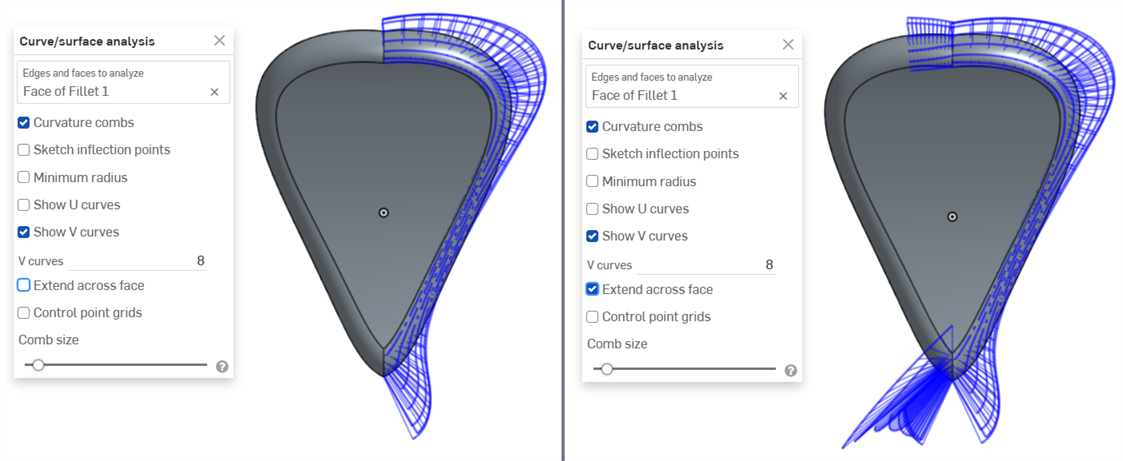
曲率梳不跨面延伸(左),也不跨面延伸(右)
控制点栅格 - 显示选定边(草图或零件边)的控制点栅格。这是控制点在定义曲面(或曲线)的基础 bSpline 曲线上的位置。控制点的数量和分布提供了有关定义形状的基础数学的重要信息。
密集的控制点群指示潜在的问题区域,并可能对曲面质量有害。简而言之,控制点栅格用于理解曲面/曲线的基本数学定义,
控制点栅格以洋红色显示:
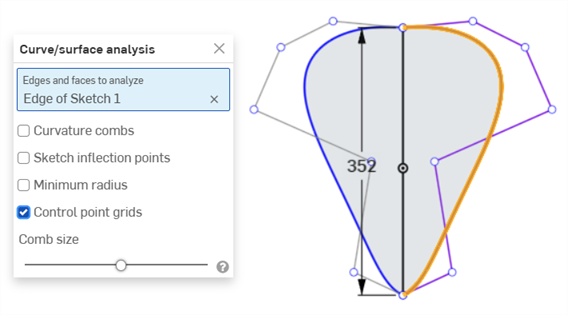
控制点栅格以洋红色显示
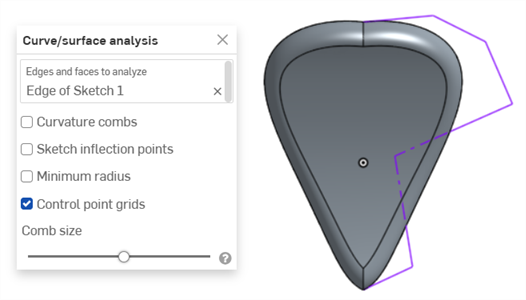
在关闭草图和显示零件的情况下显示控制点栅格
Knot points - Displays the knot points on the selected curve or surface. (Not available for non-spline entities such as cylindrical faces, intersection curves, offset curves, etc.)
Details - Displays details (such as degree, spans, and number of control points) upon hovering over the selected curve or surface. (Not available for non-spline entities such as cylindrical faces, intersection curves, offset curves, etc.)
Comb size - Use the slider at the bottom of the dialog to adjust the magnitude of the combs.
-
如有必要,单击并拖动一条曲线以调整曲率。当您拖动时,曲率梳会动态更新。
-
完成后,单击以
 关闭曲线/曲面分析对话框。
显示创建特征期间的曲率
您还可以显示正在处理的特征的曲率梳,例如,在拉伸过程中:
- 打开特征对话框后,在图形区域中右键单击,然后选择曲线/曲面分析以打开曲线/曲面分析对话框:

- 选择特征的曲线:
- 您可以显示用于创建新特征的选定边的曲率(取消选中“显示预览边的曲率”),或选择显示预览边的曲率以查看正在创建的新特征边的曲率梳:
您还可以通过在“显示曲率”对话框中选中相应选项左侧的框来显示曲率梳、反曲率点和最小半径:
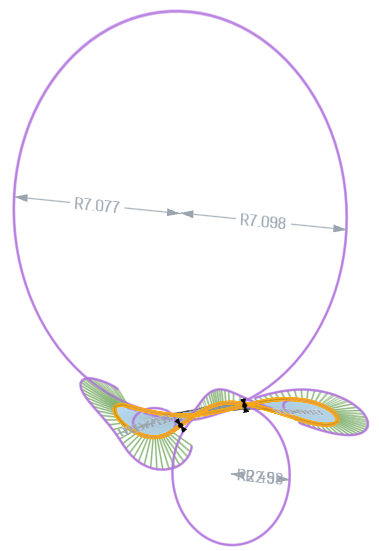
在“显示曲率”对话框中选中了“为预览的边显示”、“显示曲率梳”、“显示反曲率点”和“显示最小半径”的情况下,特征的示例。
有关曲线和曲面分析的更多信息,请参见曲面建模。
在草图或 Part Studio 中显示 2 条曲线链之间的最小和最大偏差。
-
在 Part Studio 中,在界面的右下角单击“显示分析工具”图标 (
 )。
)。 -
从菜单中选择“曲线偏差”以打开对话框:
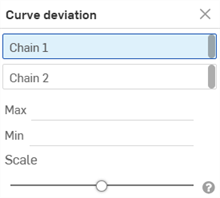
-
在对话框中选择链 1 后,在图形区域中选择一条或多条相邻的曲线。
-
在对话框中选择“链 2” 后,然后在图形区域中选择一条或多条相邻的曲线。
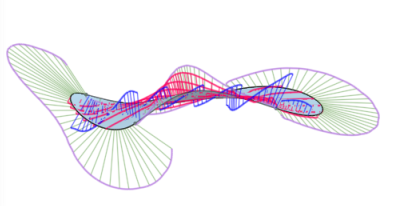
最小(蓝色)和最大(红色)偏差以及相应的极值点显示在图形区域中:
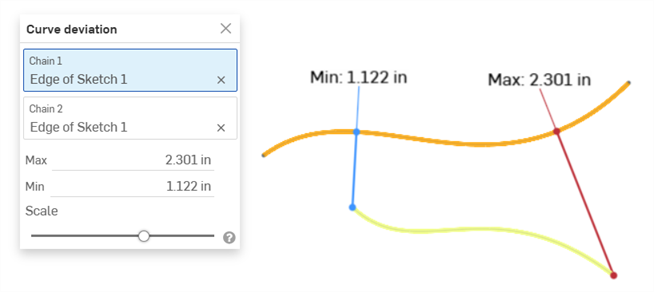
显示两条曲线之间的最小/最大偏差的示例。
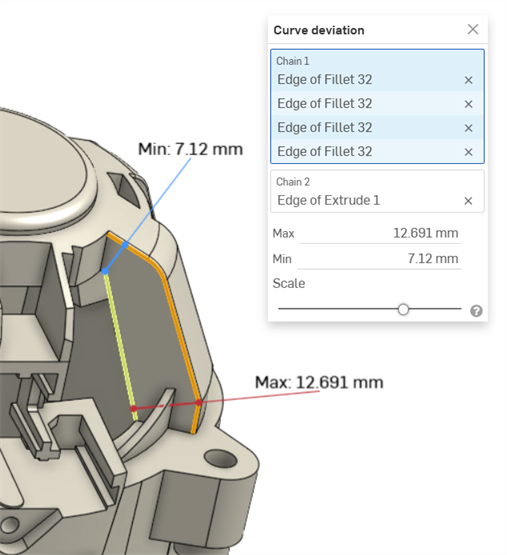
显示圆角中的链式曲线(链 1)和拉伸曲线(链 2)之间的最小/最大曲线偏差的示例。
-
或者,调整比例滑块以在图形区域中移动最小值和最大值测量标签。向左调整滑块可使标签更接近所选曲线。向右移动滑块会将标签移到离所选曲线更远的地方。
偏差计算
如果所选链的端点重合,则根据两条链的全长计算偏差。
如果所选链没有重合的端点,则所选链的端点将根据它们之间较低的最小距离值进行配对。
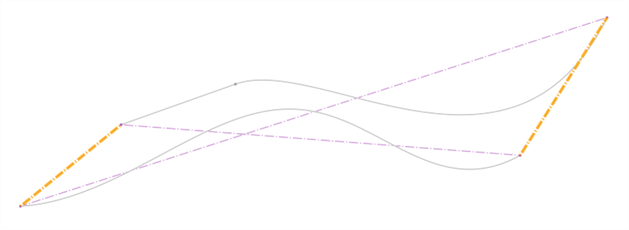
曲线偏差的计算方法如下:
-
对于每对端点:
-
计算每个端点到另一条链的最小距离。
-
用于计算偏差的范围经过修整,采用最小距离值的交点作为基准。
-
计算该范围的最大和最小偏差。
-
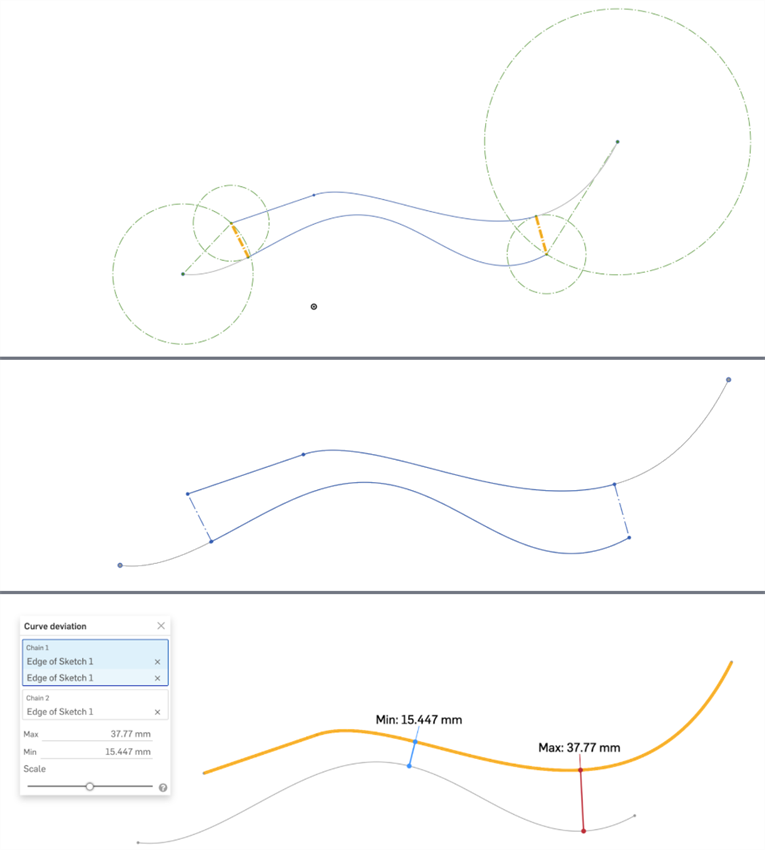
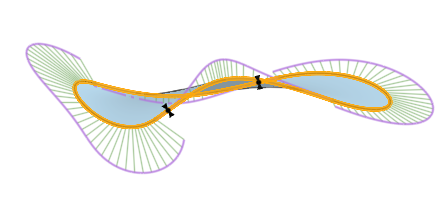
所有 3 张图像显示相同的曲线集。最小距离在顶部图像中以橙色粗体显示。在第二张图像(右端的顶部曲线和左端的底部曲线)中可以很容易地看到修剪后的曲线。底部图像显示了前两幅中标出的范围内计算得到的最大和最小偏差。
注释
-
为每条链选择的曲线必须是连续的。
-
如果多个极值点在链条之间的最大或最小偏差值相同,则仅显示其中一个。
-
如果精确选择 2 条曲线,然后打开 “曲线偏差” 对话框,则第一条选定曲线将自动放置在“链 1” 字段中,第二条选定曲线将自动放置在“链 2” 字段中,自动计算两条曲线之间的最小/最大偏差。
Assess or report the connection between curves and surfaces in a Part Studio or Sketch. Select two curves (or an edge adjacent to two faces) to analyze if the connection meets G0, G1, and/or G2 tolerances.
-
In a Part Studio, click the Show analysis tools icon (
 ) in the bottom right corner of the interface.
 -
From the menu, select Connection analysis to open the dialog box:
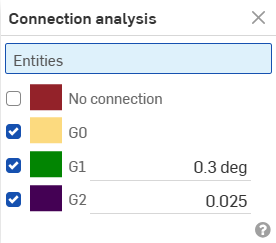
-
Select curves or surfaces to analyze; the dialog box populates with results automatically upon selection, along with color coordinated indicators in the graphics area:
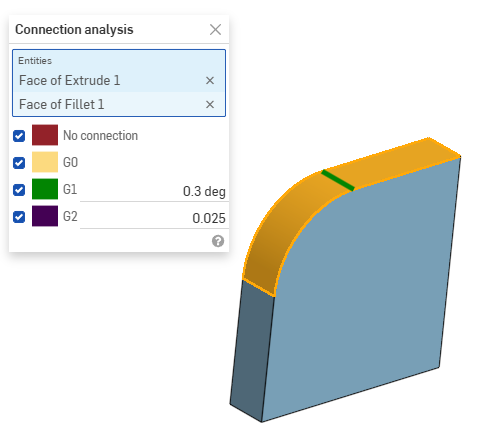
快捷键:Shift+d
显示 Part Studio 中选定边的二面角度。
在草图模式下或编辑草图时,您可以使用快捷方式 Shift+d 自动打开“二面角分析”对话框。Shift+d 作为切换开关:在仍然选中的同时,可打开和关闭对话框。
对选定对象所做的任何更改将在您下次调用该工具时保留。如果您在打开工具之前进行了预选择,则该工具将仅以该选择打开,并清除先前所做的任何其他选择。
-
In a Part Studio, click the Show analysis tools icon (
 ) in the bottom right corner of the interface.
 -
从菜单中选择“二面角分析”以打开对话框:
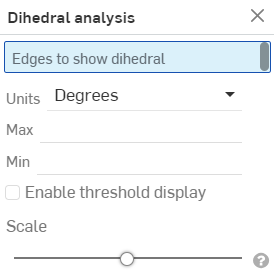
-
选择一条或多条边以显示二面角度。
-
选择您偏好的计量单位。
-
最大 - 当选中一条边(或多条边)后,将显示最大二面角度。
-
最小 - 当选中一条边(或多条边) 后,将显示最小二面角度。
-
-
可以选择“启用阈值显示”以激活可自定义的高阈值和低阈值输入框。
-
或者,使用“比例”滑块调整二面角梳形的长度。
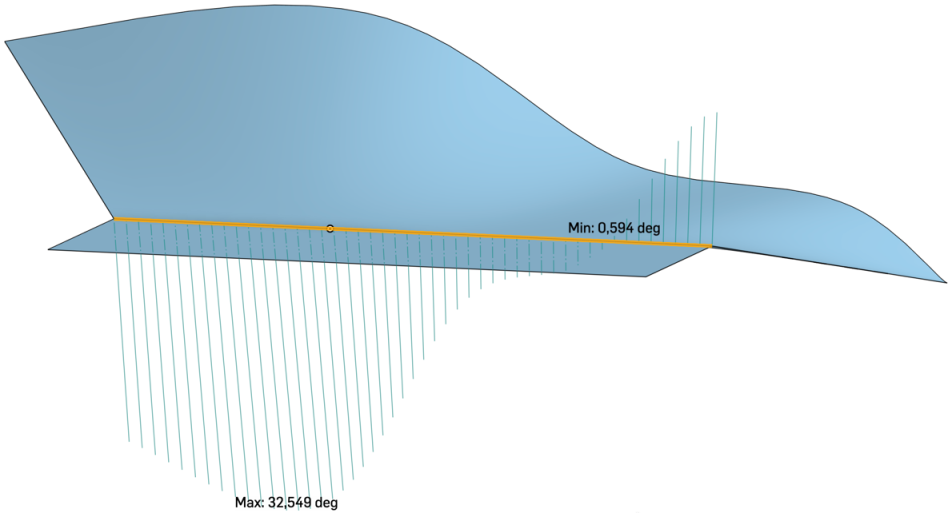
上图显示了图形区域中图元上的边应用“二面角分析”工具的示例。
在 Part Studio 或“装配体”中检测和查看任何干涉。
- 如果 Part Studio 或装配体中有多个零件,请单击界面右下角的“显示分析工具”菜单。
- 从菜单中选择“干涉检测”以打开对话框。
- 选择两个或多个零件,以查看其中的任何干扰质量。
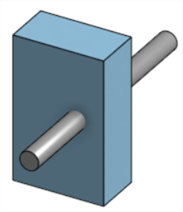
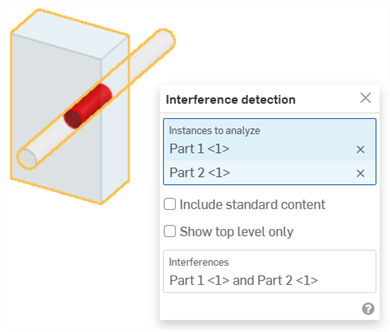
如上所述,干涉显示为红色,并且对话框的“干涉”部分中列出了涉及的部分。
将光标悬停在对话框中的零件名称上可以看到图形区域中的交叉亮显。当焦点位于对话框中的“干涉”输入框上时,图形区域将进行缩放以适应所选干涉。将光标悬停在对话框中的“干涉”输入框上,然后在图形区域中出现一个包围框,包围模型中的干涉。在对话框中,边框的长度/宽度/高度也会在悬停时显示:
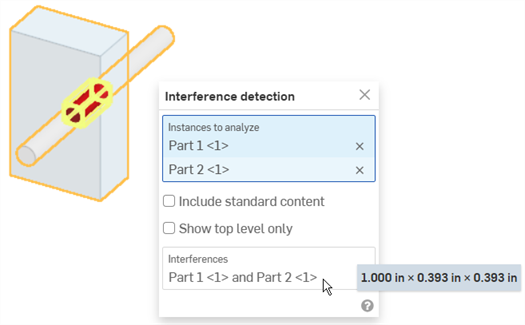
您可以使用框选来选择要进行干涉检测的图元:从左上方拖动到右下方,以仅包括该框完全包含的零件或主体。从右下角拖动到左上角以包括选框接触的任何零件或主体。
-
(可选)选择“包括标准内容”以检查是否干涉标准内容。
-
(可选)选择“仅显示顶层”以隐藏选定子装配体内部的干涉。
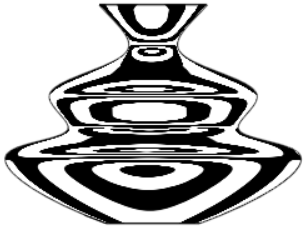
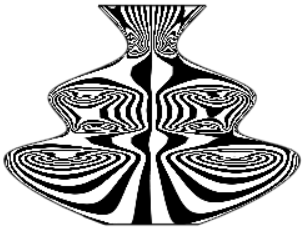
斑马条纹表示 Part Studio 或装配体中条纹空间在当前模型、面或曲面上的反射。这使您可以查看边的曲率是否已对齐且连续。
-
单击界面右下角的“显示分析工具”图标 (
 )。
)。 -
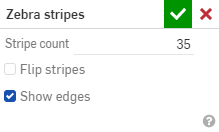
从菜单中选择“斑马条纹”以打开对话框:
-
条纹计数 - 每个曲面上显示的曲率条纹数
-
翻转条纹 - 反转条纹。
-
显示边 - 显示零件面之间的边(默认设置)。取消选中此选项时,零件边将处于隐藏状态。在某些情况下,隐藏这些边可以改进零件面之间的曲线可视化。
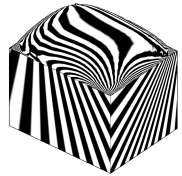
当边上的曲率对齐时,边是平滑的,条纹对齐,然后在边上突然转向:
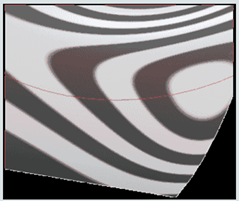
当边上的曲率连续时,边是平滑的,边上的曲率没有变化。条纹对齐,未在边上突然转向:
示例:
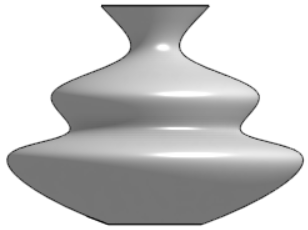
无曲率可视化 |

默认曲率:35 个条纹 |
|
10 个条纹 |
35 个条纹;已翻转 |
当您接受“斑马条纹”对话框(单击复选标记)时,对话框关闭,条纹保持不变。若要关闭斑马条纹,请再次从“显示分析”工具菜单中选择“斑马条纹”,然后单击对话框中的 X。(从“曲率可视化”菜单中选择“颜色表”也会关闭斑马条纹。)
通过在 Part Studio 的面或曲面应用您选择的颜色渐变,曲率颜色表可以更深入地研究曲率。您可以调整颜色渐变的比色刻度尺,从不同类型的颜色表中进行选择,以获得最佳的视觉呈现,从而辨别表面连续性和边之间的过渡。
-
单击界面右下角的“显示分析工具”图标 (
 )。从菜单中选择“曲率色彩映射表”:
这会将颜色表应用于图形区域中的面和曲面,使用颜色渐变来显示比例上的曲率:
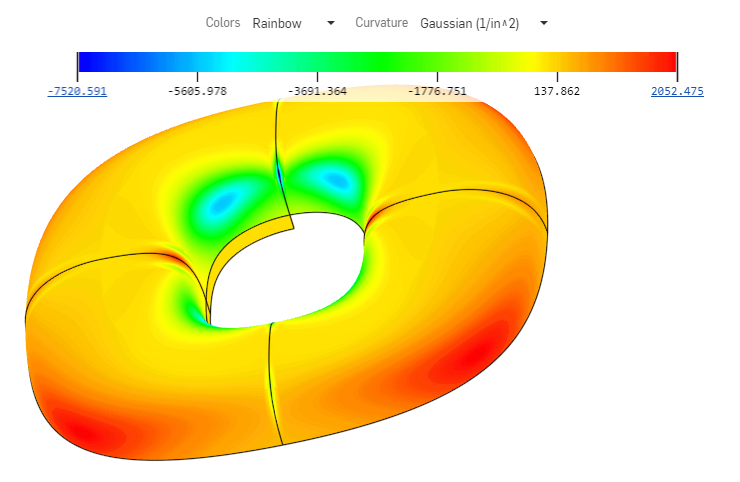
使用颜色表可视化曲率的选项包括:
-
为地图设置颜色。单击下拉菜单以选择最适合您的需求和可视化偏好的配色方案:
-
Viridis - 深紫色到浅绿色的颜色范围
-
蓝色 -> 红色 - 蓝色到红色的比例
-
Plasma - 深蓝色到浅黄色的色度
-
彩虹 - 彩虹的颜色色度
-
-
为映射选择图形。单击下拉菜单以选择特定的图形:
-
高斯 - 根据给定点上的最大和最小半径值的乘积来分配颜色。曲率显示为半径的倒数。
-
平均值 - 根据给定点上的最大半径和最小半径的平均值分配颜色。
-
最大半径 - 根据给定点上的最大半径值分配颜色。
-
最小半径 - 根据给定点上的最小半径值分配颜色。
-
您可以将颜色表重新定位到图形区域中的任何位置,以改善模型和底图的查看效果。将鼠标悬停在图形上,直到看到鼠标指针的十字线。单击图形并将其拖动到新位置。对于某些位置,图形会重新定向到竖直位置。无论图形位于何处,“颜色”和“曲率”下拉列表都位于图形区域的顶部。
提示
当曲面或面没有曲率时,因为没有计算半径,Onshape 不会为颜色表比例分配任何值。颜色表仍然可见,您仍然可以从表和颜色中进行选择。如果未计算任何值,则不应用曲率颜色。在打开任何曲率分析工具之前,模型的颜色保持不变。
您更改比例的方法可以是通过单击并拖动颜色刻度尺的端点,使之彼此靠近。比例尺上的点会重新计算,面和曲面上的颜色将根据新比例进行刷新。您也可以单击某个值并在输入框中键入数字以调整比例。请确保单击小的“刷新”图标。
使用“拔模分析”可查找模型中不符合指定的最小拔模量的面、发现切槽面域,并在 Part Studio 中查看选定几何图元的潜在分型线位置。
- 在图形区域的右下角单击“显示分析工具”图标 (
 )。从菜单中选择“拔模分析”以打开对话框和颜色图例。在对话框中,通过选择平面、面或边来指明“模具分割方向”。
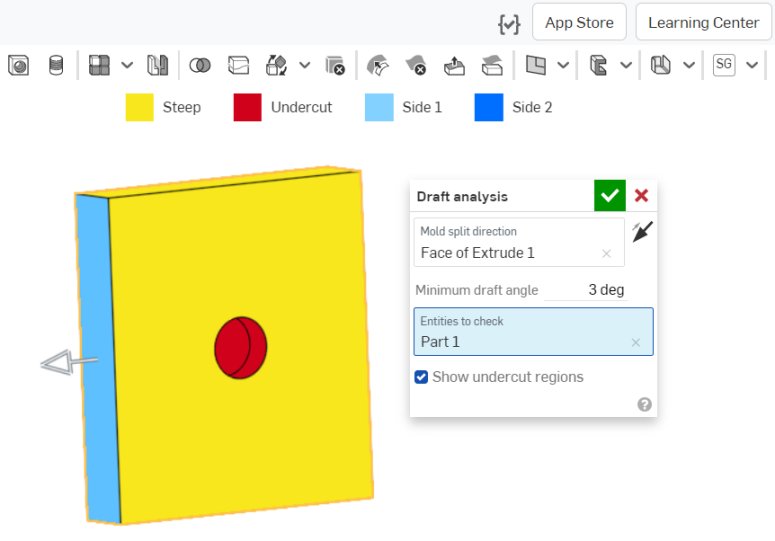
- 指定最小拔模角度。
- 选择要检查的图元。
- (可选)使用“显示切槽面域”复选框来关闭红色切槽面的指示。
请注意界面顶部的拔模分析颜色图例。
- 蓝色的面指示它们符合指定的最小拔模角度。
- 黄色的面指示它们太陡(小于指定的最小拔模量)。
- 红色的面指示切槽面。
您可以通过将光标移至模型上方来查看各个拔模的精确角度:
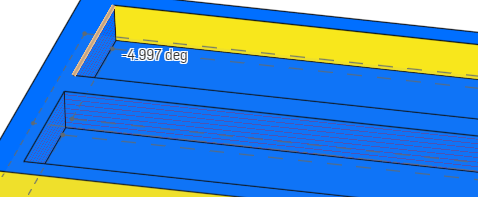
与其他可视化模式一样,在您选择其他对象之前,拔模分析保持活动状态。在它处于活动状态时,您可以编辑零件以更正拔模,并立即查看操作的效果。您也可以使用剖视图来查看模型上采用其他方式可能很难看到的地方。
拔模分析自动在两个方向上执行。Onshape 采用不同的颜色显示可接受的拔模以指示方向:浅蓝色表示第一侧(正向),深蓝色表示第二侧(负向)。操纵器箭头指向第一侧,您可以使用对话框中的方向箭头(如上图所示,在“模具分割方向”输入框旁边)翻转方向。
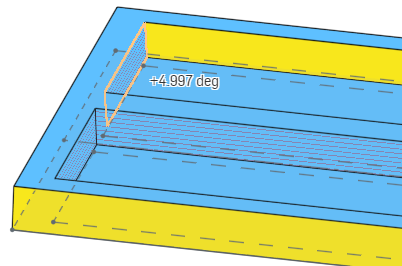
上图显示了单击方向箭头以翻转分析方向之后的拔模角度:浅蓝色显示的是正向,角度显示为正角。相比之下,在前面的图中,深蓝色显示的是负向,角度显示为负角。
使用“厚度分析”来测量零件的每个区域中分布了多少材料。
目前仅支持原生 OnShape 零件和网格模型类型。
当前,不支持封闭式复合材料。
步骤
在包含至少一个零件的 Part Studio 中:
-
单击图形区域右下角的显示分析工具 (
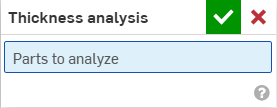
 )。从菜单中选择“厚度分析”以打开对话框:
-
选择一个或多个零件进行分析。
Onshape 立即开始计算厚度分析请求。图形区域左下角的进度微调器提供分析状态的更新:
-
准备厚度分析 - 几何图元经过离散化处理以供分析
-
处理厚度分析 - 配置高性能云实例
-
计算厚度 - 厚度分析计算开始
-
精化厚度分析中 – 提供初步结果,更高保真度的结果仍在继续处理
-
后处理厚度分析 - 最终结果正在处理中,即将公布
-
-
单击绿色复选标记接受您的选择并关闭对话框。厚度分析工具保持活动状态。当可查看初步厚度分析结果时,颜色栏将在图形区域中打开:

所选零件会自动渲染。颜色条将输入框值映射到一个或多个零件曲面上显示的颜色。
-
要更改配色方案,请从“颜色”下拉列表中选择一个调色板。
-
要更改颜色栏的范围,请选择下限值或上限值并键入新数字。使用刷新按钮将边界重置为测量输入框内的最低/最高值。
或者,单击并拖动下限值或上限值上方的刻度线,然后将其沿图例拖动到新位置。将光标悬停直至其处于活动状态,从而完全调整颜色栏的位置,然后单击图例并将其拖动到屏幕上的新位置。
除非手动调整,否则在完善中间厚度分析结果的同时,图例的边界可能会自动调整到新的极限。一旦手动调整,中间更新将不会导致上限或下限发生变化。但是,随着新信息的出现,颜色栏上最远的值可能会更新。
图例显示用户定义边界之外的输入框值的独特颜色。选中“调暗比色刻度尺”选项以创建 3 色视图并快速评估目标范围之外的区域。

-
从“方法”下拉菜单中选择首选输入框:
-
滚球
-
滚球梯度 (%)
-
射线
-
射线梯度 (%)
使用“厚度分析”时,您可以继续在 Part Studio 中正常工作。当您进行编辑时,厚度评估将自动更新。
-
-
要编辑厚度分析,请单击图形区域右下角的显示分析工具 (
 ),然后从菜单中选择“编辑厚度分析”。
 -
要关闭厚度分析,请单击显示分析工具 (
 ),然后选择“关闭厚度分析”。
滚球厚度法
滚球厚度法计算零件曲面上每个点上可以内接的最大球体的大小。
球体与检查点相切,零件上至少还有一个点相切(尽管它可能与多个零件相切),因此据说它会沿着零件内部滚动,同时改变尺寸。测量的厚度报告为内接球体的直径。
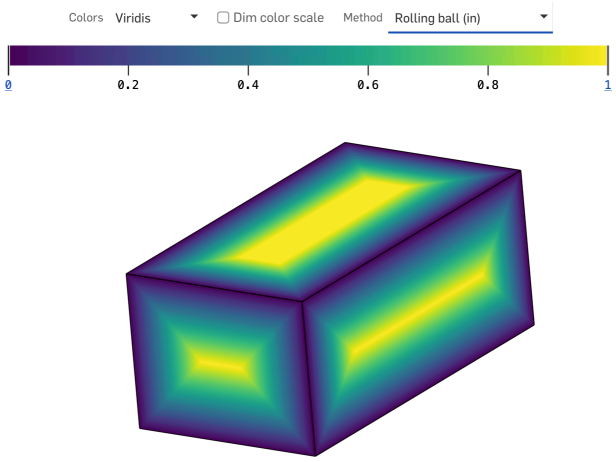
提示
-
滚球厚度法提供的厚度测量由目标区域内多个点的局部非平凡几何关系定义。
-
保证滚球厚度分布在任何实心零件的所有区域都是连续的。
射线厚度法
射线厚度法计算沿直线路径穿过零件内部的距离。
在零件曲面的每个点,一条光线垂直投射到该曲面,在零件沿线的另一个点第一次交叉时终止。这两点之间的线段长度是射线厚度。
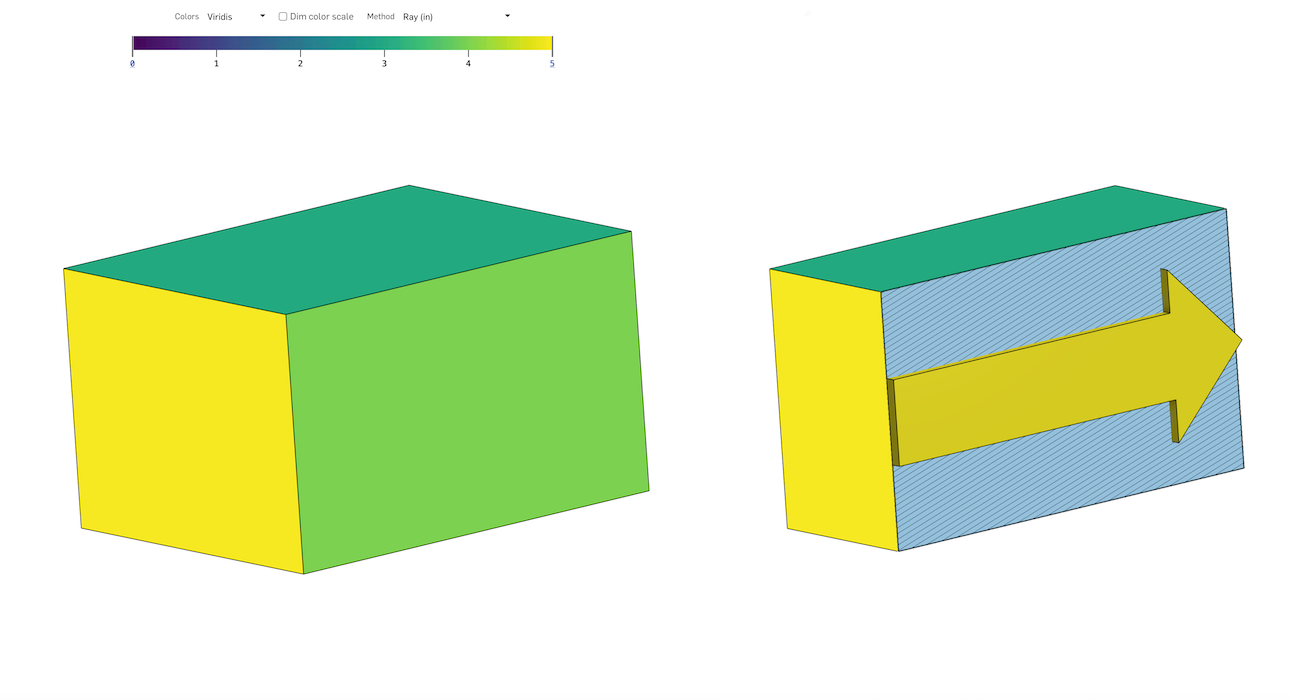
提示
-
沿零件曲面垂直投影到一个点的直线不能保证与零件曲面的第二点有任何几何关系。
-
整个零件的射线厚度分布很少是连续的。它将包含明显的不连续性,最明显的是在尖角附近。
厚度梯度(射线法或滚球法)
厚度梯度测量零件沿着零件曲面移动时厚度变化的速度。值本身是以下项的比率 (A/B):
-
当从零件曲面上的一个点向任何方向移动(名义上和瞬间)时,厚度可以增长或收缩的最大量,以长度为单位测量。
-
沿所述方向行进的名义瞬时测地距离,以相同的长度单位测量。
该比率是非维度的、非负的,不符合惯例,以百分比 (%) 表示。
展平曲面从一个或多个连续的非平面曲面生成平面曲面。
该工具执行几何展平以创建具有最小应变能的曲面。
展平操作会忽略曲面平整零件的材料属性。生成的曲面没有材料属性。
展平曲面的某些用途:
-
评估应用于零件特定区域的油漆遮罩的平坦(切割)形状。
-
评估在零件的弯曲区域上贴花而不产生过度拉伸或起皱的可行性。
-
在给定外模线 (OML) 和板层边界的情况下,确定复合层的切割形状。
-
向平面曲面添加特征(切口、文本曲线、文本包覆),并使它们重新形成弯曲的曲面形状。
制造商和装配商经常在曲面应用贴花、包覆或覆盖物。虽然它们通常来自平面图纸,但它们粘附的曲面并不总是平坦的。Onshape 的“展平曲面”工具从一个或多个连续的非平面曲面生成平面曲面,从而实现更平滑的应用。
当您将平面图纸应用于非平面曲面时,它不可避免地会拉伸和压缩。Onshape 的“展平曲面”工具可进行几何展平,以最小的应变能创建曲面。
展平的曲面不考虑材料定义。由此产生的展平曲面没有材料特性。
这款刮刀手柄需要带纹理的握把套。
在 Part Studio 中,单击图形区域右下角的“显示分析工具”图标。选择“展平曲面”。
选择一个或多个连续面进行展平。然后单击“展平”按钮以执行拼合操作。
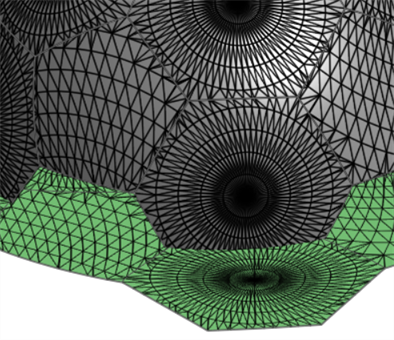
“展平曲面”工具为反馈提供了多种可视化效果。“展平刻面”显示原始曲面和平整曲面上的网格刻面。
禁用“显示刻面”后,“显示边”可在展平曲面上显示边。
“显示棋盘”在原始表面和展平曲面上均显示棋盘阵列。通过输入棋盘比例来调整阵列的比例。较低的值会导致较大的棋盘方块,较高的值会生成较小的棋盘方块。
“显示失真”会显示拼合过程在几何上扭曲的展平曲面区域。失真区域以红色或蓝色显示。蓝色表示张力或拉伸,红色表示压缩或压痕。颜色较强的区域表示失真值较高的区域。
选中“显示已展平”以显示生成的曲面。
选择要展平的曲面的原点。如果不选择原点,Onshape 会自动为展平曲面选择一个原点。
通过输入“展平偏移量”或“展平角度”值,进一步定位展平曲面。
“展平曲面”工具不会在零件列表中创建零件。选中“显示导出控件”以显示导出选项。将展平曲面导出到 Parasolid 或 STL,以在文件中获得曲面的物理展示。如有必要,可以使用“派生”特征将文件导入 Part Studio 中。
或者,选择导出格式为 SVG 或 DXF,然后单击“导出”按钮将文件发送到您的设备。然后,您可以在外部软件(例如 Adobe Illustrator)中处理贴花。
仔细检查这个已展平的曲面,发现手柄底部附近有明显的变形。退出“展平曲面”工具并应用分割特征以向面添加更多边。
选择“展平曲面”,然后为“接缝”边选择一条边。单击“展平”。已展平的曲面已沿选定边分割或撕裂,从而减轻了拉伸和压痕造成的压力。
在 Part Studio 中:
-
单击图形区域右下角的显示分析工具图标 (
 )。从菜单中选择 “展平曲面”以打开对话框:
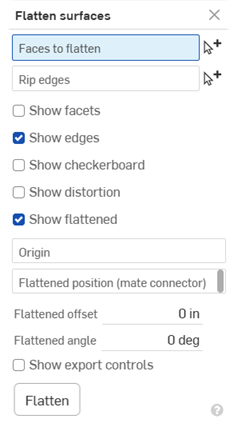
-
选择“要展平的面”输入框后,在图形区域中选择一个或多个连续面。
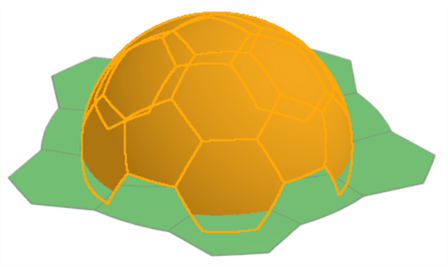
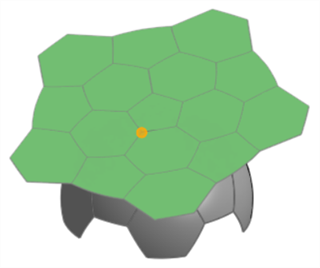
部分足球被展平的示例。请注意,在显示结果之前,必须先按下“展平”按钮。
-
在对话框中单击选择“接缝边”输入框,然后在图形区域中选择应接缝展平曲面的任何边。
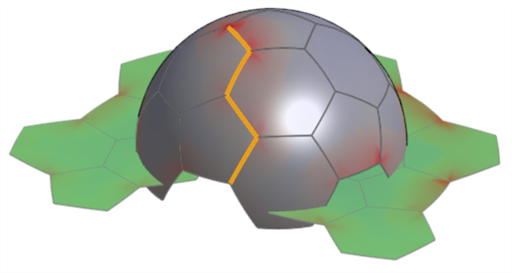
使用的接缝边示例。请注意,这有助于减少展平曲面的扭曲。与下方“显示扭曲”选项下显示的图像进行比较。
-
选中以下可选的显示设置,然后输入相应的输入值:
-
显示刻面 - 选中可在原始曲面和展平曲面上显示网格平面。
-
显示边 - 默认情况下,展平曲面上的边是可见的。取消选中可隐藏这些边。
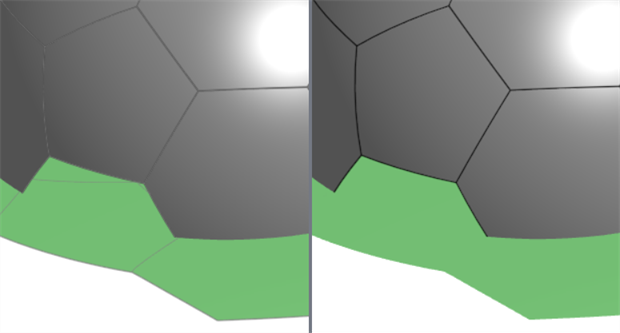
已启用显示边(左)和禁用显示边(右)
-
显示棋盘 - 选中可显示叠加在原始表面和平面上的黑白棋盘阵列。
-
棋盘比例 - 设置棋盘图案比例。值越低会生成较大的图案方块。值越高,生成的图案方块越小。
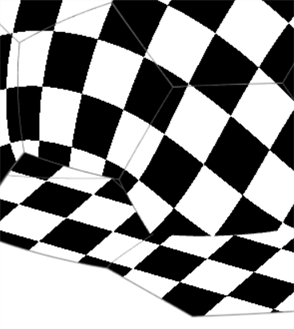
显示棋盘;棋盘比例:25
-
-
显示扭曲 - 以洋红色显示展平曲面中因展平过程而出现几何扭曲的区域。颜色越强,扭曲发生的次数就越多。
-
扭曲比例 -设置报告的扭曲灵敏度级别。值越高,扭曲灵敏度越高(报告扭曲度越大)。较低的值会降低扭曲灵敏度(报告的扭曲度较小)。
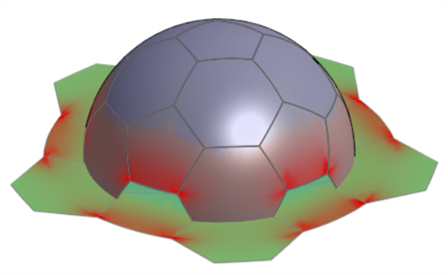
-
-
显示展平 - 显示展平结果。这允许您打开或关闭展平结果。
-
展平的位置(嵌合连接器) - 选择嵌合连接器,将展平曲面结果放置在选定曲面下方以外的位置。
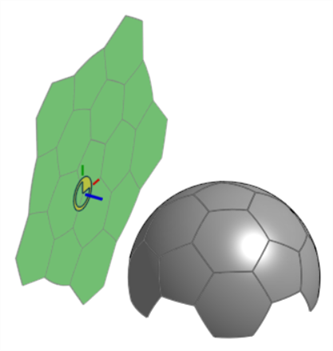
-
展平的偏移量 - 如果将嵌合连接器用于“展平的位置”,请输入正数值或负数值以沿嵌合连接器的 Z 轴偏移该位置。
-
展平的角度 - 如果将嵌合连接器用于“展平的位置”,请输入正或负角度值,以相对于嵌合连接器的 Z 轴偏移该位置。
-
-
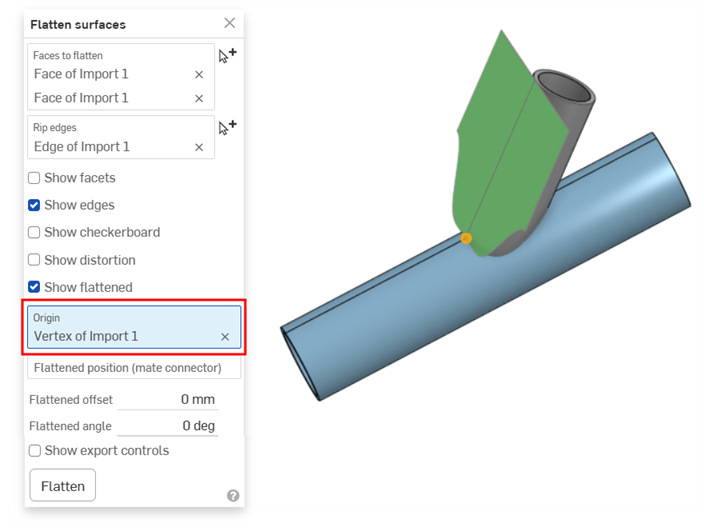
原点 - 选择用作生成的展平曲面原点的顶点。
-
-
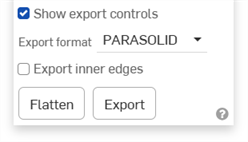
单击“显示导出控件”以显示导出选项:
-
导出格式 - 从文件格式选项列表中选择:PARASOLID、STL、DXF 或 SVG。
-
导出内边 - 如果要展平的面包含多个面,则导出内边。
示例
-
导出按钮 - 单击“导出”按钮,将最终的展平曲面结果下载到您的设备上。
-
-
单击“展平”以显示对话框输入生成的最终展平曲面。
展平以获得贴花或油漆遮罩曲面。
“展平曲面”工具的一种用途是从多个非平面曲面中提取一个平坦的曲面,用作贴花或油漆遮罩。
在下图中,侧视图似乎是一个完美的圆圈。实际上,您需要提取弯曲的曲面,将其展平,贴上贴花,然后将贴花粘贴在曲面上:
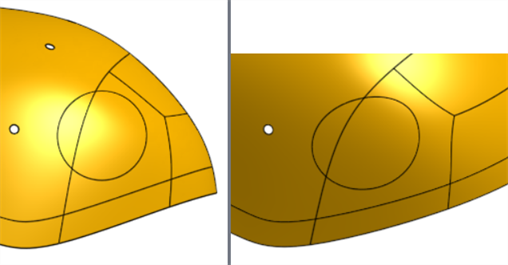
使用“展平曲面”工具获取贴花切口:
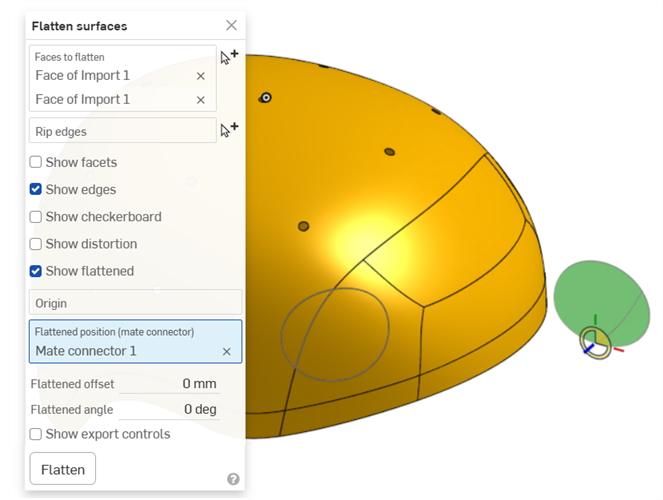
有了曲面后,选中“显示导出控件”,选择 SVG 或 DXF 作为导出格式,然后单击“导出”按钮将文件发送到您的设备。然后,您可以在外部软件(例如 Adobe Illustrator)中处理贴花。
导出内边
在未选中和选中“导出内边”的情况下导出与上述相同的示例。(在对话框的 “显示导出控件” 部分下):
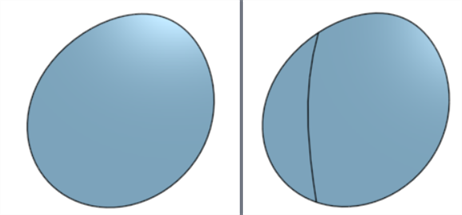
导出边禁用(左)和启用(右)
展平管道
在此示例中,管道已展开。这是一个可以开发的曲面,添加切口会产生没有扭曲的展平曲面:
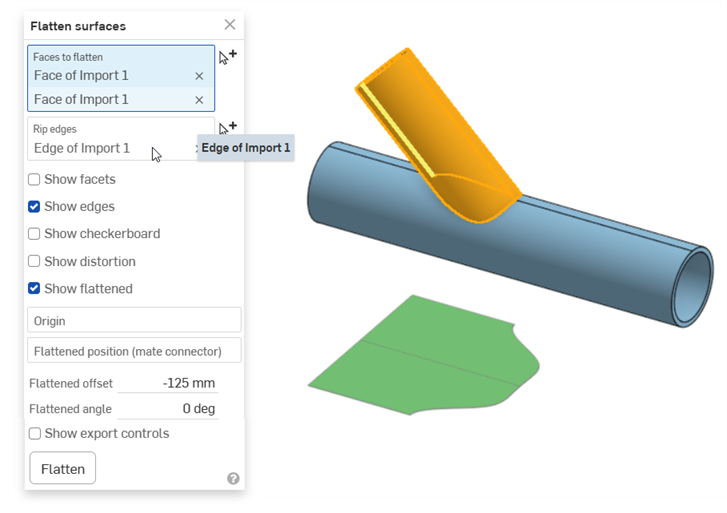
将原点设置为管道顶部的顶点允许您可视化曲面如何沿管道边缘展平:
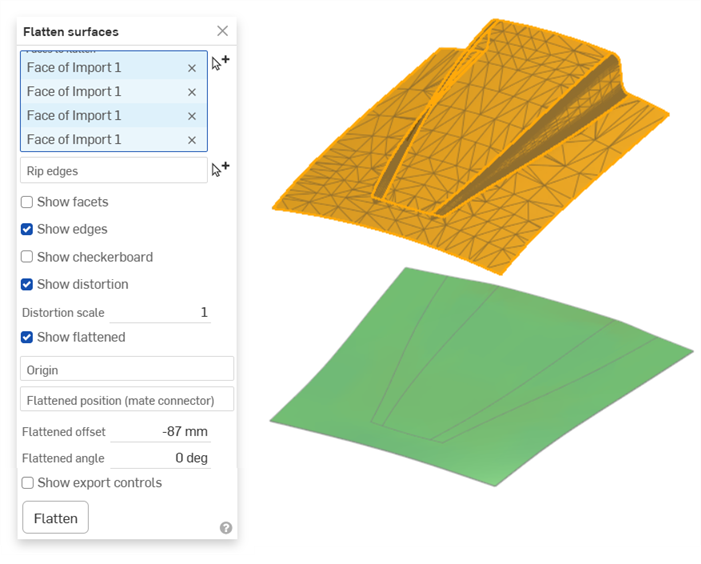
汽车引擎盖
此示例显示了作为网格导入 Onshape 的汽车引擎盖的扫描曲面。通常,您需要从该曲面上创建油漆保护膜 (PPF)。这在引擎盖、挡泥板、大灯的前表面和其他曲面上很有用。导入是展平的,几乎没有扭曲:
-
某些选项在更新后需要再次按下展平按钮。例如,如果添加了接缝边,或者选择了原点。
-
“展平曲面”工具不会在零件列表中创建零件。导出展平曲面以在文件中获得曲面的代表。然后,如果需要,可以将此文件导入 Part Studio。
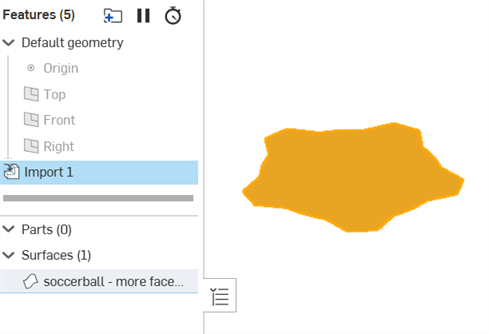
导入的展平曲面示例。曲面使用 PARASOLID 文件格式导出,导入到文档中,然后使用“派生”特征导入到 Part Studio。
-
平整表面无法提供完美的精度。不应使用“展平曲面”来获取用于计算的关键或精细测量值。它应该用于提供一般尺寸,以便将贴花之类的东西包裹在非平面曲面上。
