Resource Reports
![]()
Resource reports provide information on daily and detailed document and modeling activity.
Accessing Resource reports
Access Resource reports by:
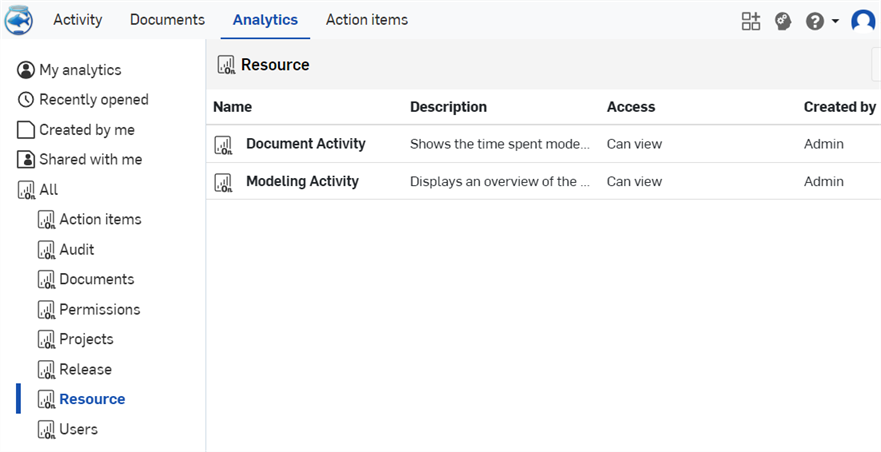
- Select Analytics from the title bar.
- Select the Resource filter in the left pane.
- Select the specific report in the list.

Document Activity
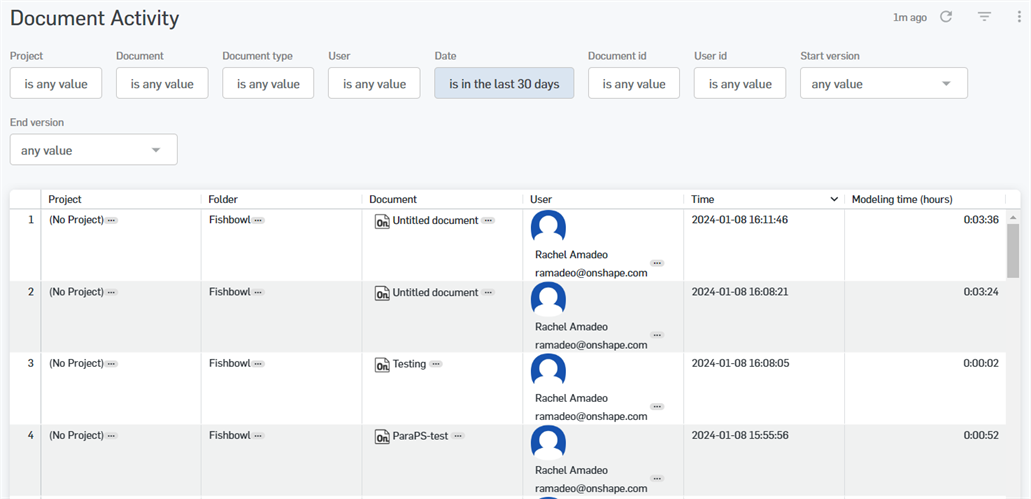
The time spent on a document for a given user. Use the filter to specify a project and date range to display information like:
- Project - The name of the project for which details are displayed.
- Folder - The name of the folder.
- Document - The name of the document.
- Date - The date for which the information is displayed.
- User - The name, email, or ID of the user for which details are displayed.
- Modeling time (hours) - The amount of time (in hours) the named user spent modeling in the named document.

Filters
Use the Filters control at the top left of the report to refine the report. See Controls available within dashboards for more information.
The following filters are available:
-
Project
-
Document
-
User name, email, or ID
-
Date
-
Document id
-
Start version
-
End version
You can see the modeling time spent between specific versions of the same document using the Start version and End version filters.
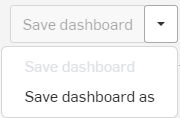
Optionally, save the dashboard using the dropdown options at the top of the interface (above the dashboard filters):
Modeling Activity
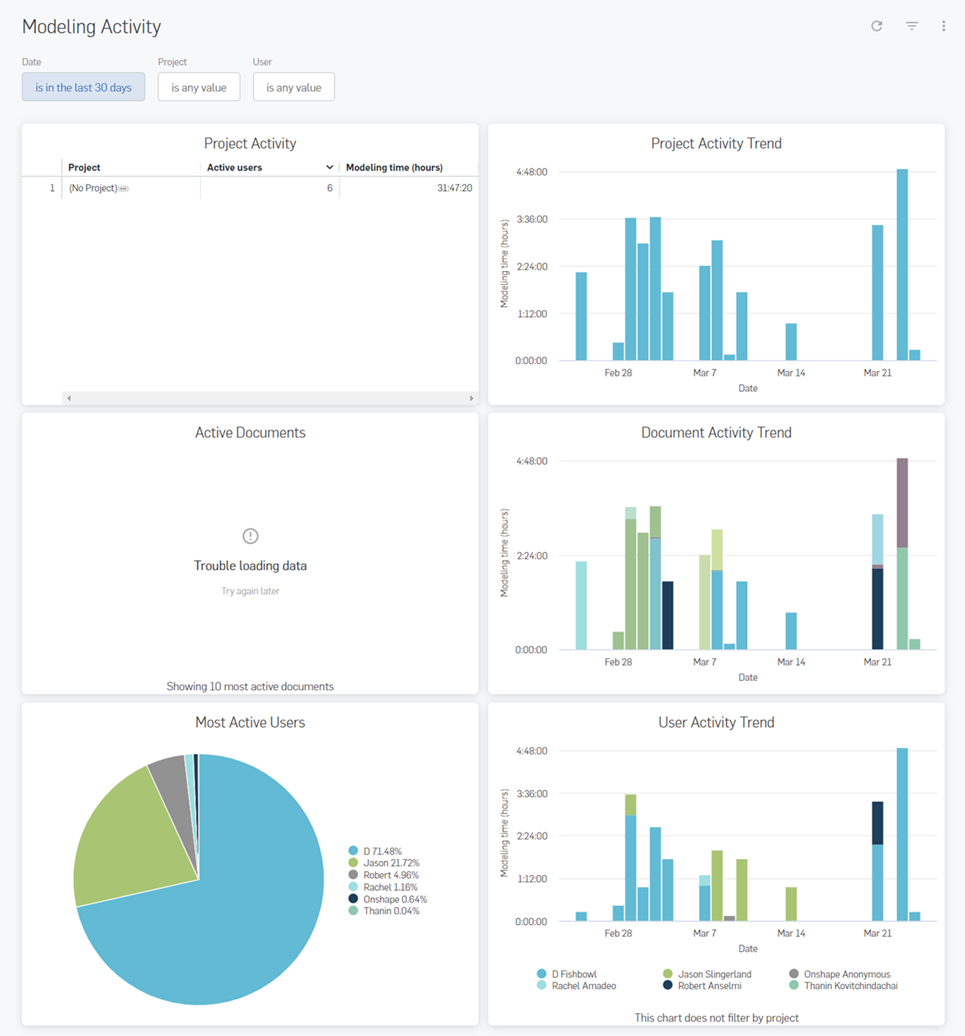
The Modeling Activity dashboard displays an overview of modeling activity across the entire company. Display activity by project, documents, and users for a particular duration as well as view trends over time, including:
- Project Activity - The number of active users and the total modeling time per project. The (No Project) row contains information for all documents not in a project.
- Project Activity Trend - The amount of modeling time per project over time.
- Active Documents - The percentage of time spent modeling for each active document.
- Document Activity Trend - The amount of time spent modeling in each document over time.
- Most Active Users - The percent of time each user has spent modeling, showing up to 10 users.
- User Activity Trend - The amount of time each user has spent modeling over time.
As with all reports, you are able to drill into any data on the dashboard.

Filters
Use the Filters control at the top left of the report to refine the report. See Controls available within dashboards for more information.
The following filters are available:
-
Date
-
Project
-
User name, email, or ID
Optionally, save the dashboard using the dropdown options at the top of the interface (above the dashboard filters):