Analytics
![]()
![]()
![]()
Onshape provides dashboards for a variety of categories of information.
Each user has access to all of the reports available to the enterprise, as long as they have been granted access to the Access analytics global permission by the Enterprise administrator:
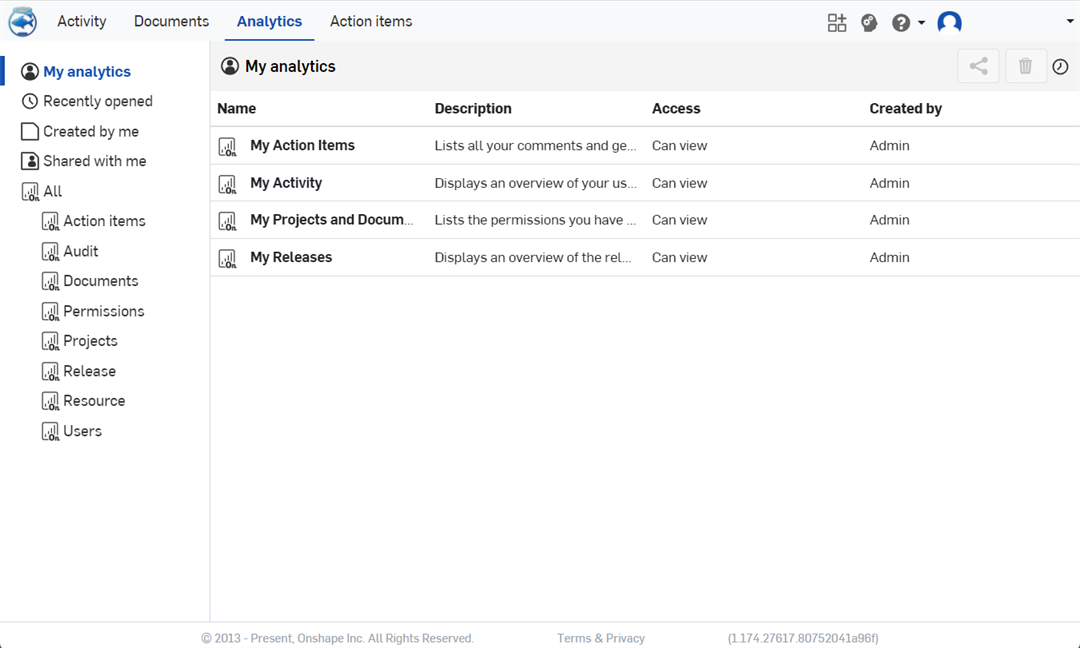
Select a dashboard from the major list, or through one of the filters on the left. When viewing a dashboard, you can download the data through the gear menu in the upper right, or use the key combination Ctrl+Shift+D (Windows) or Cmd+Shift+D (Mac). You may download in CSV or PDF format. When viewing in a browser, be aware that the back end of the Analytics is run by Looker Data Sciences, Inc.
The left side navigation panel features contains the following options:
-
My analytics (
 ) - A filter that displays dashboards that you have saved and dashboards that have been shared to you. You can also edit a dashboard by using the filters available within the dashboard, and save that new dashboard to My analytics if you have the appropriate permissions.
 -
Recently opened (
 ) - Lists reports most recently opened by you.
-
Created by me (
 ) - Lists dashboards you have created yourself regardless of owner.
-
Shared with me (
 ) - Lists all dashboards shared with you explicitly by another Onshape user.
-
All (
 ) - Groups dashboards by the following Analytics folders: Action items, Audit, Documents, Permissions, Projects, Release, Resource, and Users. Clicking the All filter displays a list of folders by Name and Number of dashboards under each one. Click on a Folder from either the navigation panel or the folder Name link to access all the dashboards in that folder.
The left-side filter panel remains open when viewing reports. This makes it easier to switch between reports.
All data is presented in dashboards with similar filtering, sorting, and refining capabilities. In general, the following controls are available:
Filter data
Filter data by selecting the filter criteria under the dashboard title (Date and Project in the example below):
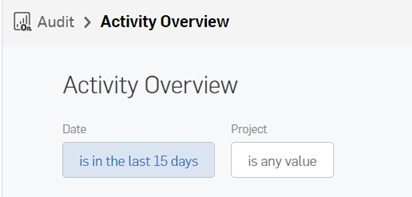
- Click the filter buttons under the Date or Project label to access and input the associated filter's criteria.
- Use the plus sign to the right of the filter criterion to add an additional criterion:
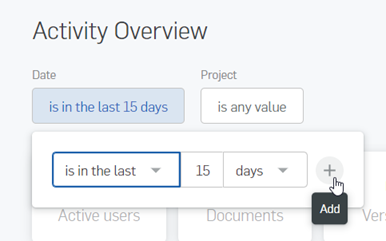
When you click the plus sign, another criterion line is available and an X appears; use the X to remove the filter's criterion.
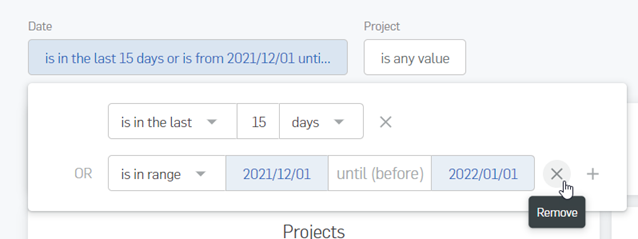
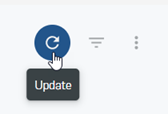
- Click Update at the top right of the report to apply the new filter changes and regenerate the report.
Save a dashboard filter
You can save a filter for use later as a dashboard.
- Select a dashboard to display.
- Make any changes to the dashboard, such as filter options.
- In the upper right corner of the report UI, click the Save dashboard dropdown and select Save dashboard as:
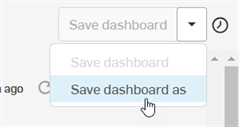
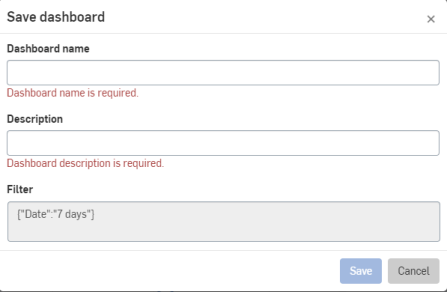
The Save dashboard dialog opens.
- Enter a Dashboard name (required) and Description (required):
- Click Save. The dashboard is included in the My Analytics filter list. The dashboard is also listed in the filter from which you initially selected the dashboard (for example, Action items, Document, or Audit reports).
Edit a dashboard
Once you've created a new dashboard, you can go back and edit that (or any) dashboard:
- Open the dashboard.
- Change any of the filters according to your needs.
- At the top right of the report, click either:
- Save dashboard to save the current dashboard with the new filter specifications.
- Save dashboard as to save the dashboard as a new dashboard with a new dashboard name, description and the specified filter.

To edit the current dashboard's name or description, click the edit icon (![]() ), make your changes and click the Save button.
), make your changes and click the Save button.
To delete a dashboard, click the trash can icon (![]() ). A cautionary message is displayed that the action cannot be undone. Click Cancel to keep the dashboard, click Delete to delete the dashboard. Deleted dashboards are removed from all lists and cannot be accessed.
). A cautionary message is displayed that the action cannot be undone. Click Cancel to keep the dashboard, click Delete to delete the dashboard. Deleted dashboards are removed from all lists and cannot be accessed.
Share a dashboard
You can share a saved dashboard with other users, if you have permission, and if the dashboard is one that has been saved (that is, not a default dashboard).
- Click Share (next to Delete).
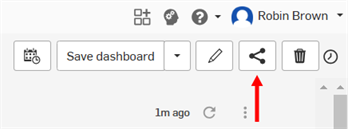
- Specify the individuals, or teams, with whom to share, select the desired permissions
- Click Share.
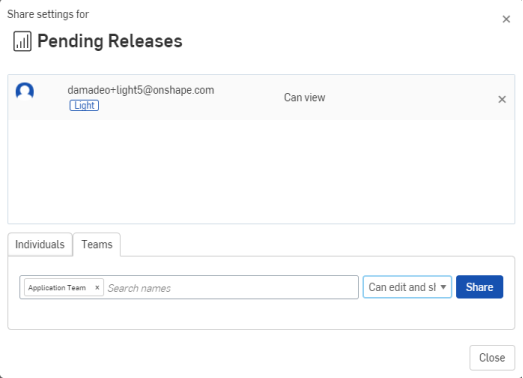
Any filters applied to the dashboard will be displayed above the dashboard when shared.
Clear the cache and refresh the report, Download data, and Reset report filters
This icon ![]() (available on hover) on a data group indicates that you are able to Clear the cache and refresh the report, Download the data, or Reset the report filters:
(available on hover) on a data group indicates that you are able to Clear the cache and refresh the report, Download the data, or Reset the report filters:
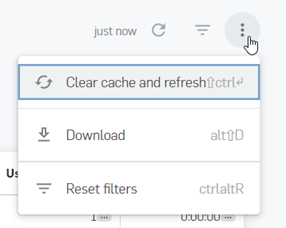
- Click the
 icon, then click Download.
 - Use this dialog to select the file output format, either CSV or PDF:
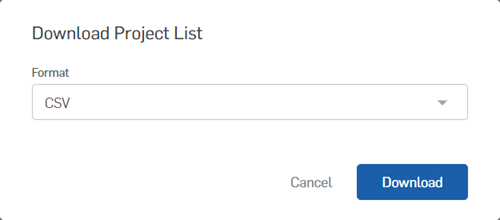
Exports are limited to 500 lines of data, even if there are more lines of data on the report display. See Tile options if you would like to download the entire data set.
Access other dashboards
Click an ellipsis next to a specific entity to access a dashboard specific to that entity: For example, clicking the ellipsis next to a release name on the Release Activity dashboard, opens the dashboard regarding that particular release (or release candidate) as shown in the second image below:
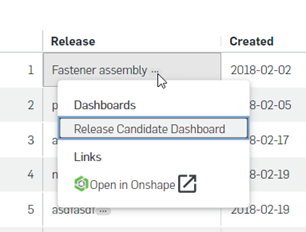
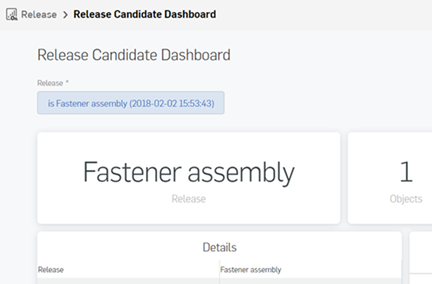
In the resulting report you can perform actions on the data, explained below by report data display entity.
Tile options
Each tile in the report has its own 3 dot menu, where additional commands are accessed. Click the 3 dot menu icon (![]() ) at the top right corner of a tile:
) at the top right corner of a tile:
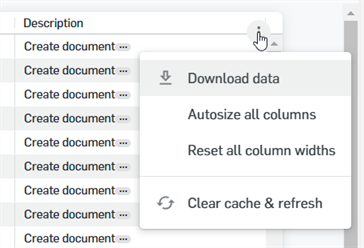
-
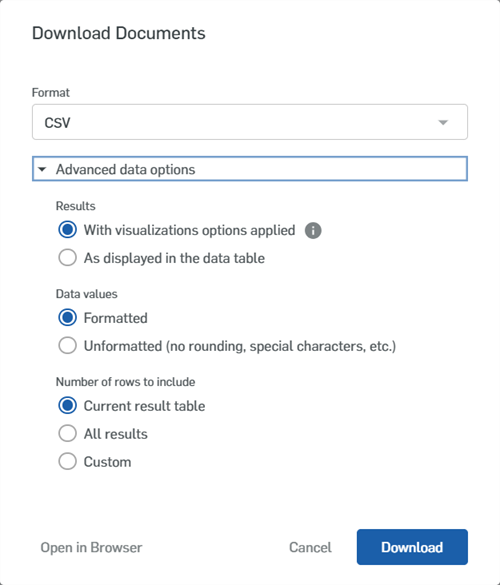
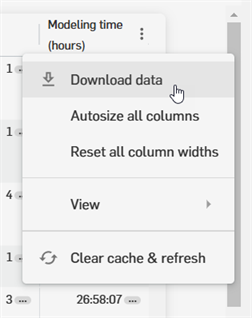
Download data - Downloads data in the table.
-
Format - Selects the format for the data: TXT (tab separated values, Excel spreadsheet (Excel 2007 or later), CSV, JSON, HTML, Markdown, or PNG (Image of Visualization).
-
Advanced data options:
-
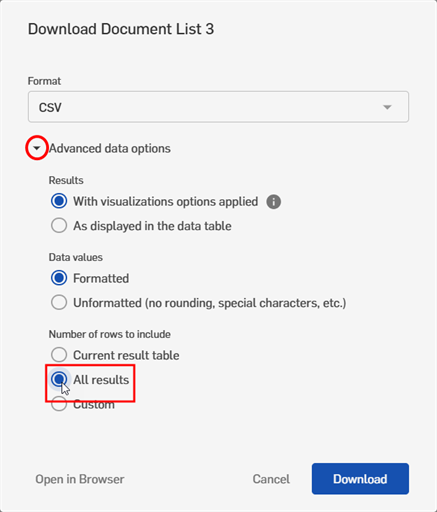
Results - With visualizations options applied means that any customizations done for this visualization will be reflected in the download. This includes options like re-labeling columns, hiding totals or adding conditional formatting. Learn more. As displayed in the data table shows only the values from the data table.
-
Data values - Formatted formats the values. Unformatted means no rounding, special characters, or other formatting are visible.
-
Number of rows to include - Current result table displays only the results as shown on-screen. All results shows all data results (and is not constricted to 500 data rows). Custom allows you to enter the number of rows to download.
-
-
-
Autosize all columns - Autosizes all column widths in the table for a better data fit.
-
Reset all column widths - Resets to the default column width.
-
Clear cache and refresh - Deletes the tile data cache and refreshes the tile data.
Tables
You can sort by any column with a caret next to the name (^ for instance): click the column name or the caret to sort by that column. You can also act on the data in table cells:
- Click the underlined name (or the ellipsis) to open a menu of related dashboards; select one to display that dashboard, or select the Open in Onshape link to open the document in Onshape (in another tab)
- Click an underlined (on hover) data point in a column to open a detailed information panel
For instance, click on a Modeling time to open a detail panel showing a breakdown of users and their time spent modeling:

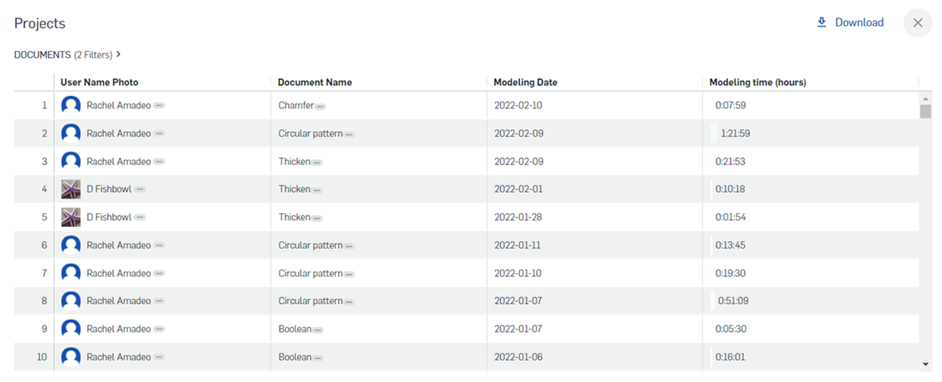
Click the X in the upper right corner of the detail panel to close it.
Charts
Hover over segments of the pie charts to see detailed information:
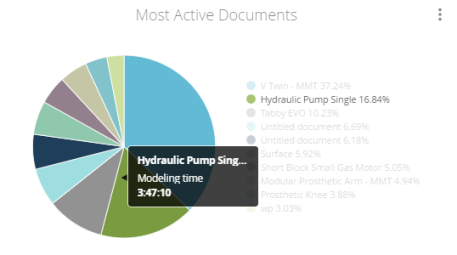
Hover over a line in the legend to see the coordinating section of the chart highlight.
Click the hover information to access a menu of related dashboards; click to select one or to open the referenced document.
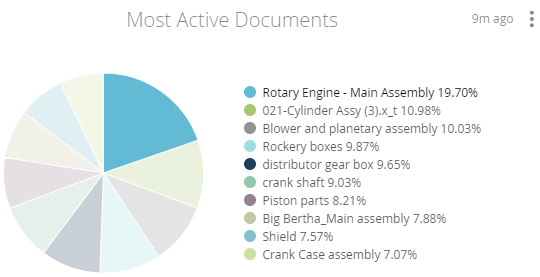
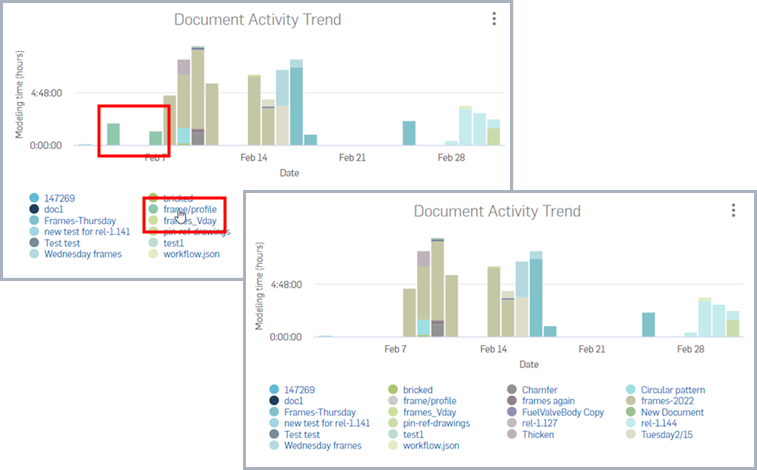
Click an item (in a bar chart) or hover (in a pie chart) in the legend to toggle the display of that data (or the remaining data)
Maps
Maps show the worldwide locations of activities. Click and drag to reposition the map for access to specific regions. Use the zoom icons on the map to zoom in and out. Click a point on the map to display information about that location's activities. Click the information to open a panel with more detailed information.
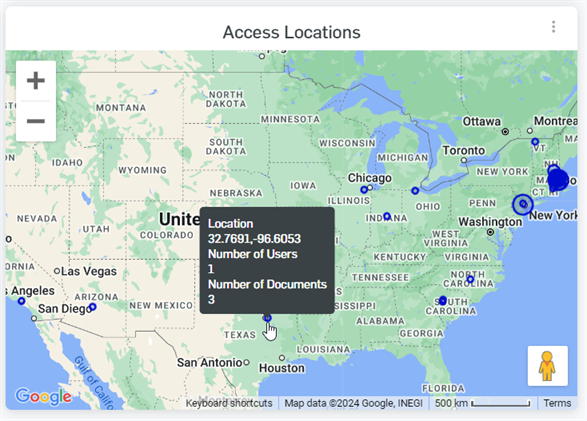

Click the X in the upper right corner of the detail panel to close it
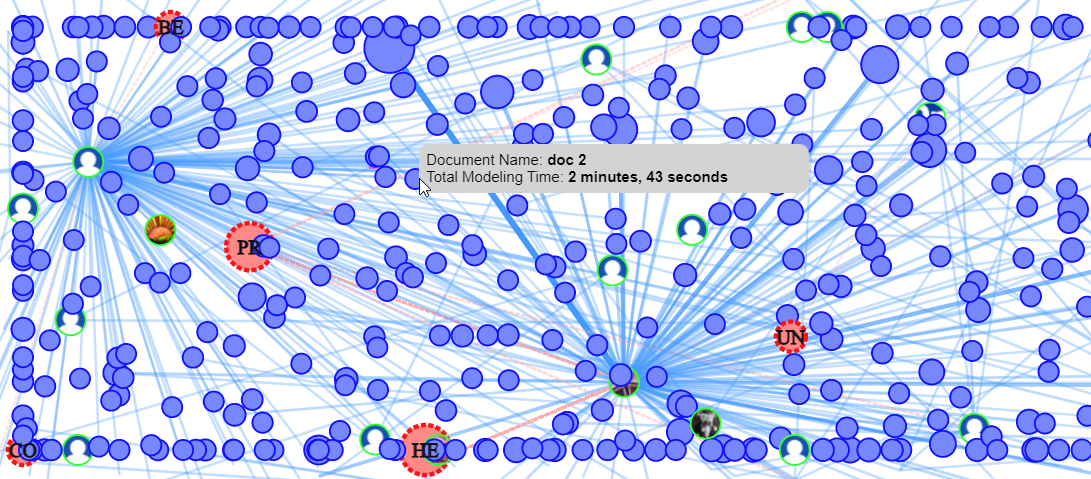
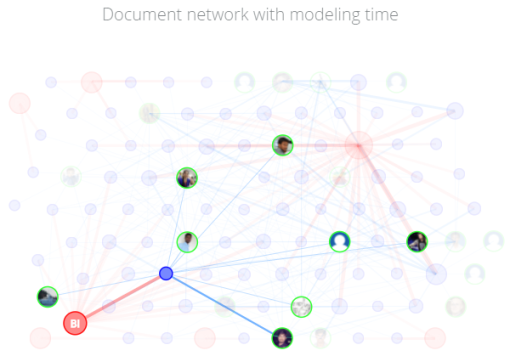
Web
Webs display summary information; hover over a hub point to display summary information. Click to reduce the web to information relating directly to the hub selected. Click again to revert to all data.
By default reports display and download only the first 500 rows of data. To access more than 500 rows of data, you must access the option to download all results.
-
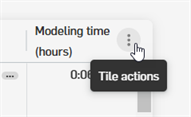
Hover your mouse over the top right corner of the last column to show the 3 dot menu icon (
 ):
):
-
Click on this menu option, and select Download data:
-
The Download dialog opens, click the Advanced data options dropdown, and then click the All results radio button:
-
Click the Download button.
The entire table generates a file that is placed in the Downloads folder on your computer. This file contains all rows of data in the report.
Onshape provides dashboards for a variety of categories of information.
Each user sees and has access to only the reports that the Global permissions grant access to. The main page lists all the dashboards available to you, depending on the Global permissions associated with your account.
Export any dashboard through the gear menu in the upper right. You can export as a PDF or a Single Column PDF. When viewing in a browser, be aware that the backend of the Analytics is run by Looker (Looker Data Sciences, Inc.).
All data is presented in dashboards with similar filtering, sorting, and refining capabilities. In general:
- The three dot icon (available on hover) on a data group indicates that you are able to download the data.
- Filter data by expanding the dropdown under the dashboard title. When filter criteria is selected, tap Run on the right of the section to run and display the new report:
- In tables:
- Sort by almost any column; select the column name to sort by that column.
- Act on the data in cells:
- Click to open a menu of related dashboards; select one to display that dashboard
- Click to open the referenced document in another tab
- Click to open a detailed information panel
- In charts:
- Hover to see detailed information
- Click the hover information to display a menu of related dashboard; click to select one or to open the referenced document
- Click an item (in a bar chart) or hover (in a pie chart) in the legend to toggle the display of that data (or the remaining data)
- In maps:
- Use the zoom icons to zoom in and out.
- Click and drag to reposition the map
- Display information about a map point; click to display
- In webs:
- Display summary information; hover over a hub point to display summary information. Click to reduce the web to information relating directly to the hub selected. Click again to revert to all data.
Onshape provides dashboards for a variety of categories of information.
Each user sees and has access to only the reports that the Global permissions grant access to. The main page lists all the dashboards available to you, depending on the Global permissions associated with your account.
Export any dashboard through the gear menu in the upper right. You can export as a PDF or a Single Column PDF. When viewing in a browser, be aware that the backend of the Analytics is run by Looker (Looker Data Sciences, Inc.).
All data is presented in dashboards with similar filtering, sorting, and refining capabilities. In general:
- The three dot icon (available on hover) on a data group indicates that you are able to download the data.
- Filter data by expanding the dropdown under the dashboard title. When filter criteria is selected, tap Run on the right of the section to run and display the new report:
- In tables:
- Sort by almost any column; click the column name to sort by that column.
- Act on the data in cells:
- Click to open a menu of related dashboards; select one to display that dashboard
- Click to open the referenced document in another tab
- Click to open a detailed information panel
- In charts:
- Hover to see detailed information
- Click the hover information to display a menu of related dashboard; click to select one or to open the referenced document
- Click an item (in a bar chart) or hover (in a pie chart) in the legend to toggle the display of that data (or the remaining data)
- In maps:
- Use the zoom icons to zoom in and out.
- Click and drag to reposition the map
- Display information about a map point; click to display
- In webs:
- Display summary information; hover over a hub point to display summary information. Click to reduce the web to information relating directly to the hub selected. Click again to revert to all data.