Projects Reports
![]()
The Project Dashboard report illustrates the events within a single project. Select a project to see project-specific data, including: total modeling time, number of documents in the project, file imported and modeling time for the project.
Accessing Projects reports
Access Projects reports by:

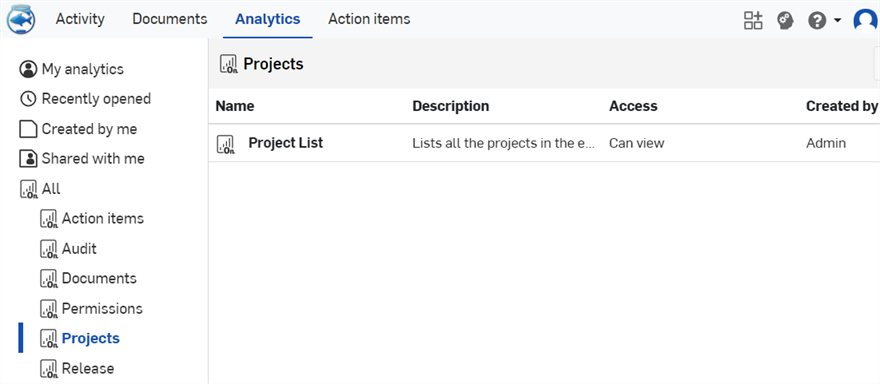
- Select Analytics from the title bar.
- Select the Projects filter in the left pane.
- Select the specific report in the list.
Project List

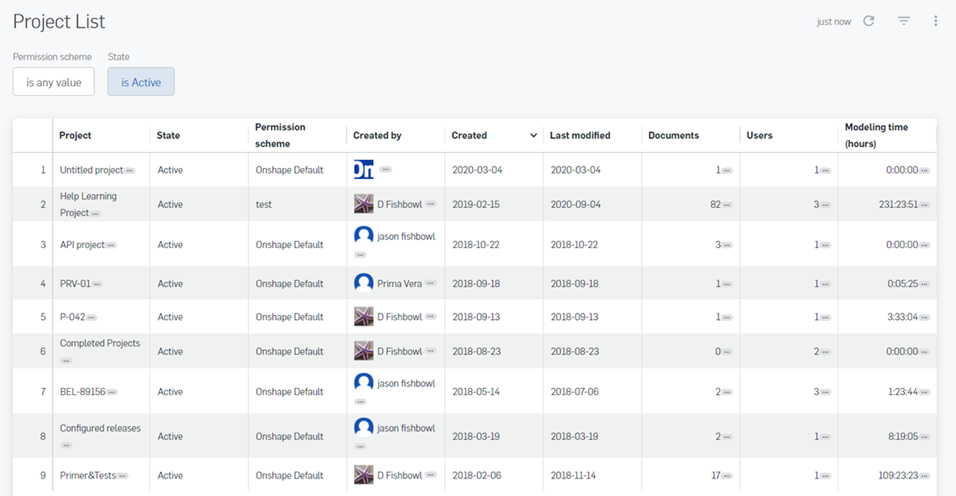
Lists of all projects in the Enterprise and their summary information. Use the filter to specify a particular Permission scheme for which to provide the information, including:
- Project - The name of the project fulfilling the search criteria.
- State - The state of the document: Active or Deleted.
- Permission scheme - The name of the permission scheme that allows access to this project.
- Created by - The user who created the project.
- Created - The date the project was created.
- Last modified - The date on which the project was last modified.
- Documents - The number of documents in the project.
- Users - The number of users with permissions to the document.
- Modeling time (hours) - The total amount of modeling time performed in the project (all users, on all documents).
Click on a specific Project in the list for a menu including:
-
Project Dashboard - A dashboard including filters of Project, Date, and Role name, and showing projects with: number of imports, number of exports, number created. Also displayed is the total modeling time, shares, drawings, and releases.
-
Document List - A list of all documents, filterable by Project, Document name, Document state, Modified date, Created by, and Folder.
-
Project Activity - A report of all projects or specific projects and the associated numbers of active users, documents created, version, releases, shares, imports, exports, and drawings.
-
Link - A link to open the project on the Onshape Documents page
Filters
Use the Filters control at the top left of the report to refine the report. See Controls available within dashboards for more information.
The following filters are available:
-
Permission scheme
-
State
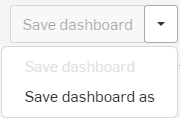
Optionally, save the dashboard using the dropdown options at the top of the interface (above the dashboard filters):