曲線/曲面分析
![]()
在草圖、Part Studio、組合件中提供此功能
快速鍵:shift+c
「曲線/曲面分析」在 Part Studio 中使用不同的方法視覺檢視與分析草圖或零件上的曲率。透過快速鍵 (Shift+c)、草圖、零件或曲面上的環境選單,或透過介面右下角的「顯示分析工具」功能表來存取「曲線/曲面分析」對話方塊。
當在草圖模式中或是在編輯草圖時,您可以使用快速鍵 Shift+c 來自動選取所有草圖曲線並開啟「曲線/曲面分析」對話方塊。Shift+c 如同切換鍵:當選取項目持續存在時可開啟與關閉對話方塊。
即使在退出草圖之後,曲線/曲面分析工具仍會保持為開啟,不過選取項目欄位並不是使用中。只要工具是開啟的,您可以加入更多選取項目或是移除項目。您下一次叫用工具時對選取項目的變更仍會存在。如果您在開啟工具之前已經做出預選,則開啟工具時會僅有該選取項目,系統會清除之前做出的其他選擇。
檢查曲線與曲面:
- 按一下介面右下角的「顯示分析工具」 (
 )。
)。 - 選擇曲線/曲面分析來開啟對話方塊。您也可以在圖形區域中於草圖或零件上按右鍵,然後從環境選單中選擇來存取這個對話方塊:
-
選擇要分析的邊線和面,或者是在存取對話方塊之前先選擇邊線和面。
- Select from the following options:
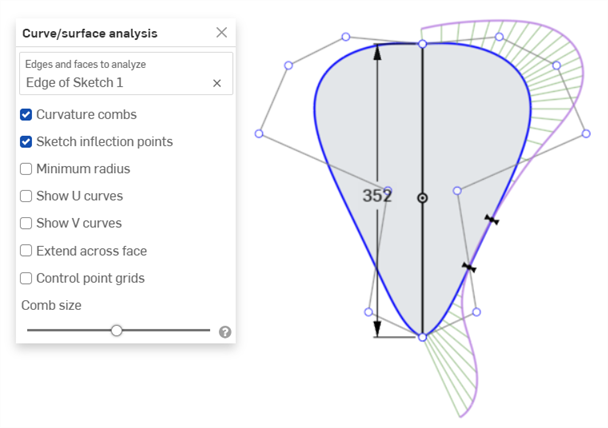
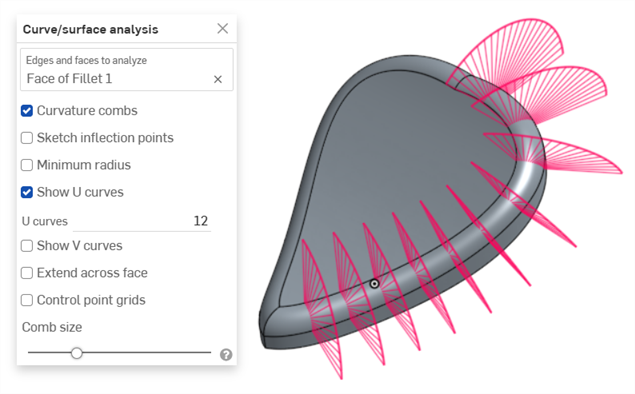
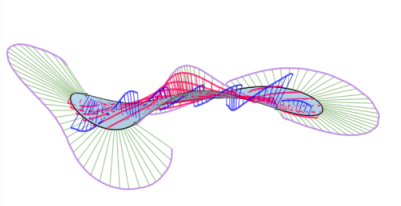
Curvature combs - Displays the combs of the selected edge(s) and/or face(s) along the U and V directions. Curvature combs are evaluated at evenly spaced isolines, not necessarily at the control points, and are used for evaluating the resultant shape of a curve/surface up to Flow (G3) continuity.
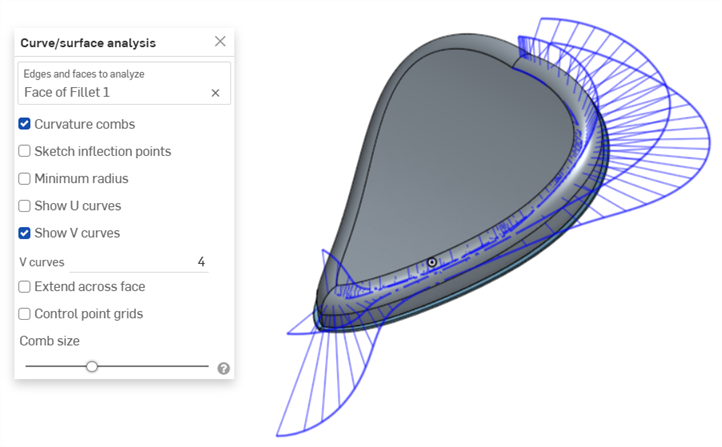
Curvature combs on the V direction on a face
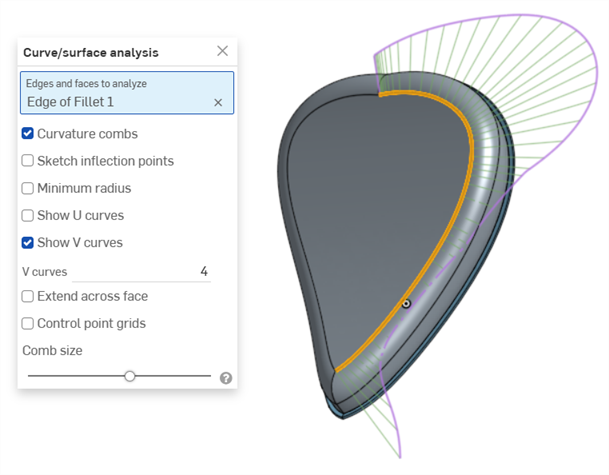
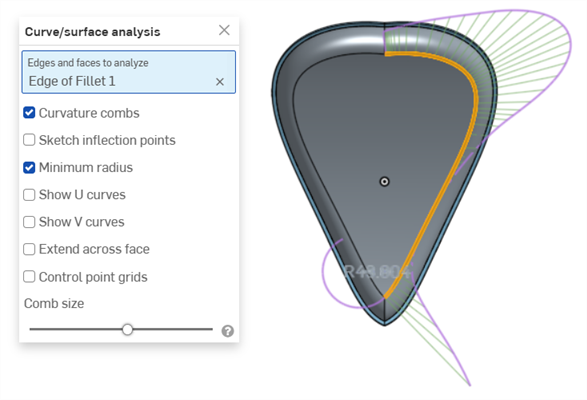
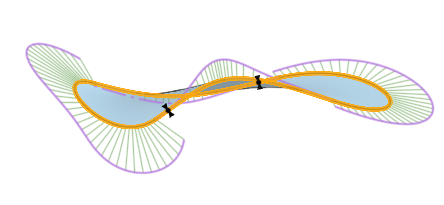
Curvature combs on an edge. Combs are shown in green, bounded in magenta.
Show U curves - Displays curvature combs along the U direction. U curves are displayed in red:
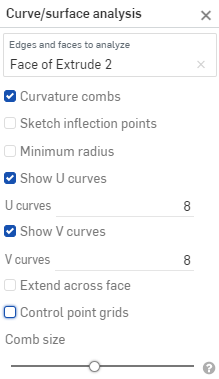
Show V curves - Displays curvature combs along the V direction. V curves are displayed in blue:
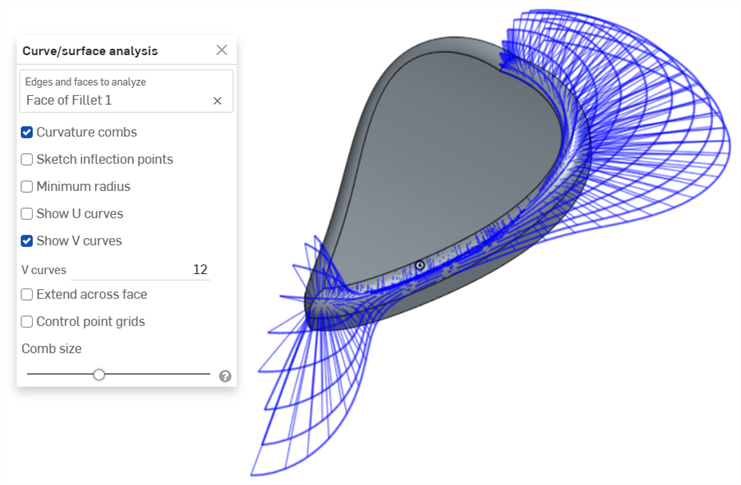
Increase or decrease the number of curves using the numeric U curves and V curves fields, from 2 to 64. The default is 8 for each.
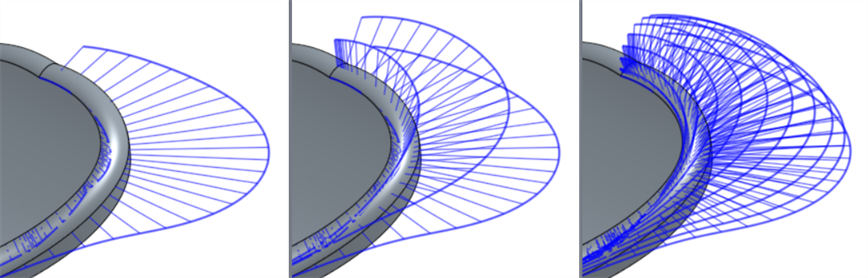
V curves set at 2 (left), 4 (middle), and 8 (right)
Sketch inflection points (sketch only) - Displays the inflection points along a sketch edge. They appear as black 'bow ties':
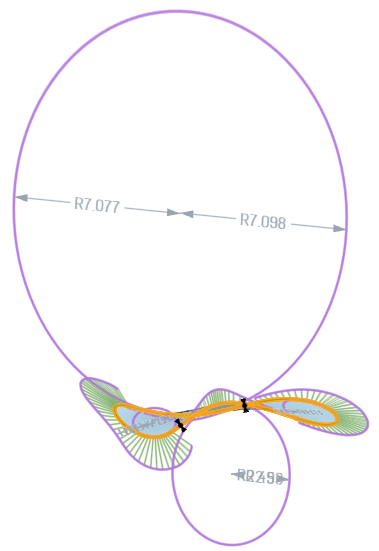
Minimum radius (edges only) - Shows the minimum radius along an edge, either a sketch or part edge:
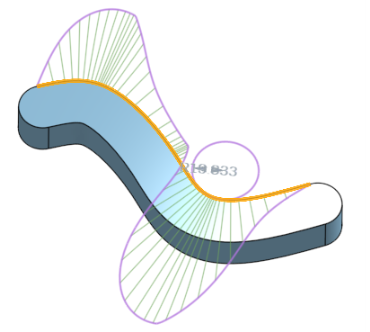
Extend across face - Extends the curvature combs along adjacent faces:
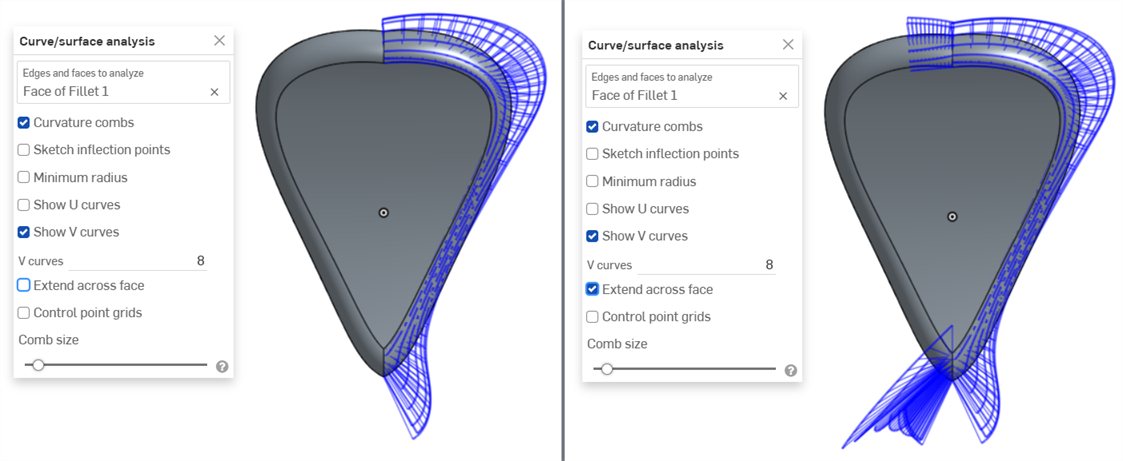
Curvature combs not extended across faces (left) and extended across faces (right)
Control point grids - Displays the control points grid for the selected edge, either a sketch or part edge. This is the location of the control points on the underlying bSpline curves that define the surface (or curve). The number and distribution of the control points provides important information about the underlying math defining the shape.
Dense clusters of control points indicate potential problem areas, and can be deleterious to the surface quality. In short, control point grid is used to understand the underlying mathematical definition of the surface/curve,
Control point grids are shown in magenta:
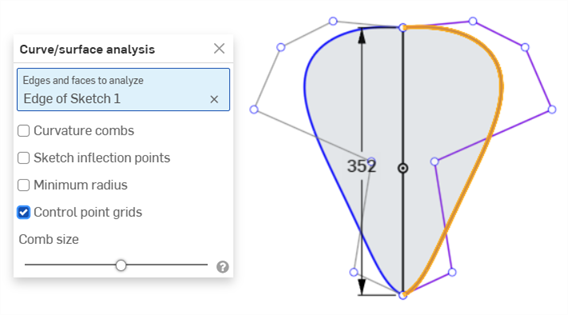
Control point grids displayed in magenta
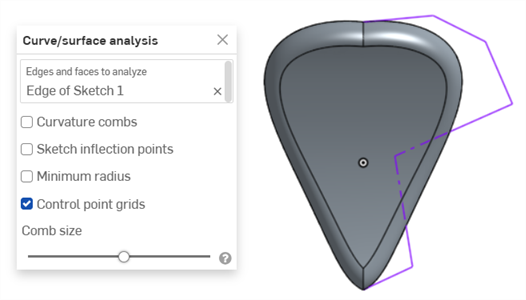
Control point grids displayed with the sketch closed and the part displayed
Knot points - Displays the knot points on the selected curve or surface. (Not available for non-spline entities such as cylindrical faces, intersection curves, offset curves, etc.)
Details - Displays details (such as degree, spans, and number of control points) upon hovering over the selected curve or surface. (Not available for non-spline entities such as cylindrical faces, intersection curves, offset curves, etc.)
Comb size - Use the slider at the bottom of the dialog to adjust the magnitude of the combs.
-
如果需要,點按與拖曳曲線來調整曲率。會在拖曳的過程中動態更新曲率梳。
-
完成時按一下
 來關閉「曲線/曲面分析」對話方塊。
您也可以顯示處理中特徵的曲率梳。例如,在擠出的過程中:
- 在特徵對話方塊開啟的同時,在圖形區域中按右鍵,然後選擇 [曲線/曲面分析] 來開啟「曲線/曲面分析」對話方塊:
- 選擇特徵上的曲線:
- 您可以顯示用來建立新特徵的所選邊線曲率 (取消核取 [顯示預覽邊線]),或選擇顯示預覽邊線來查看新特徵建立邊線的曲率梳:
您也可以選取「顯示曲率」對話方塊中選項左側的核取方塊來顯示曲率梳、拐點與最小半徑。
在「顯示曲率」對話方塊中選取「顯示預覽邊線」、「顯示曲率梳」、「顯示拐點」與「顯示最小半徑」時特徵的範例。
關於曲率與曲面分析的詳細資訊,請參考曲面模型建構。