EDU Enterprise Dashboards
![]()
![]()
![]()
Dashboards with the EDU Enterprise provide information on Documents, Classes and Students. Anyone with View access to a document can view its Document Dashboard analytics.
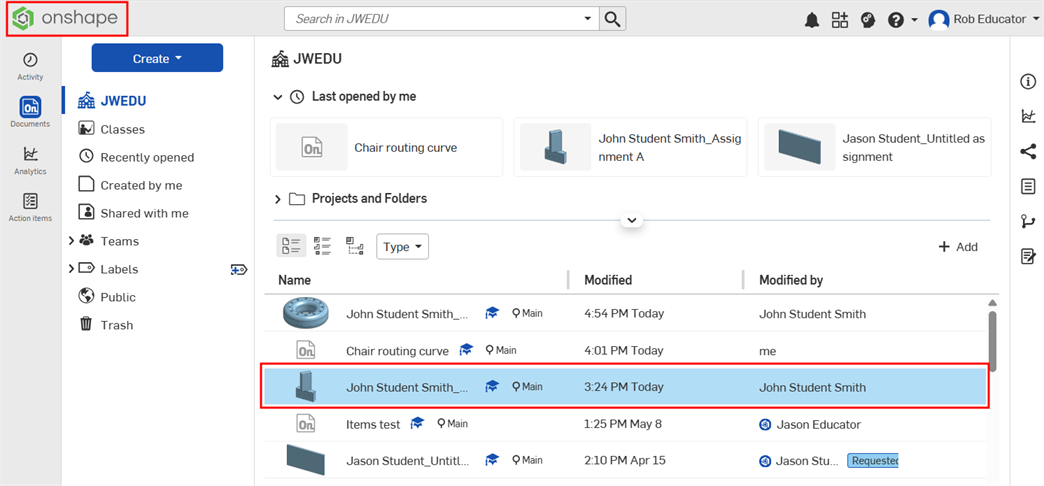
Access the Document Dashboard for a specific document. Educators can access Analytics for their documents and their students' documents. Students can access analytics for their own documents.
-
Click the company logo at the top left to access the Documents list.
-
Select a document in the list to highlight it:
-
Click the Analytics icon (
 ) on the right to access the Documents panel.
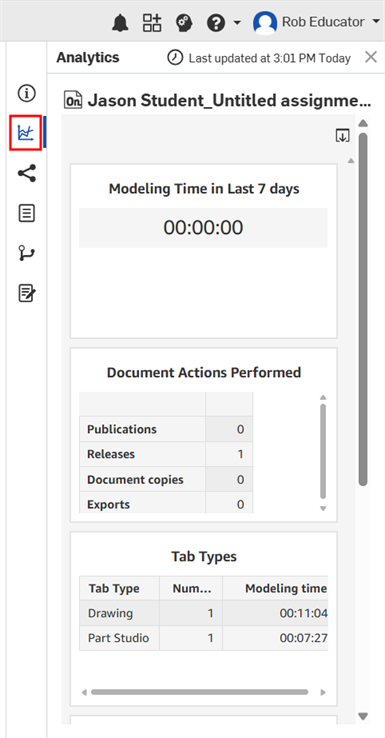
The panel contains the following information:
-
Modeling time in last 7 days - Count visual displaying the amount of modeling time, in hours, for this document over the last 7 days
-
Document actions performed - Table visual displaying the amount of actions taken in this document; for example, Publications, Releases, Document copies and Exports
-
Tab types - Table visual displaying the number of each tab type used in this document; for example, Part Studio, Assembly, and Drawing
-
Modeling activity - Vertical bar chart displaying the Modeling time, in hours, by date, for this document
-
Access locations - Map visual displaying the location this document was accessed and the number of users who accessed it.
Educators can access dashboard for their classes:
-
Select the class from the Classes list.
-
Select Dashboard at the top of the Class page:
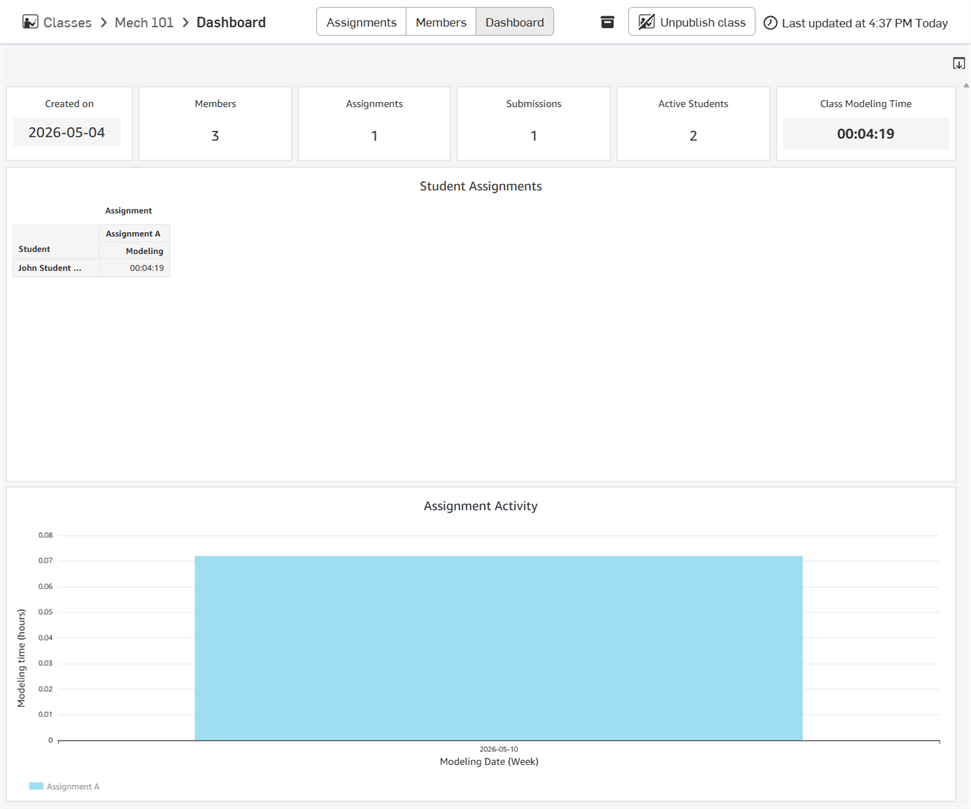
The dashboard displays and contains information you can click on and analyze:
-
Created on - Date on which the Class was created.
-
Members - Count visual displaying the Number of members. Click to access a Classes and Assignment sheet containing information about the user name, role, submissions embedded, and modeling time.
-
Assignments - Count visual displaying the Number of assignments published for the class with class name, the state of the assignment, and the created date.
-
Submissions - Count visual displaying the Number of submissions by students of the class with class name, assignment, user name, document name, created date, and submitted on date.
-
Active Students - Count visual displaying the Number of active students assigned to the class with user name, email, state name, created date, and modified date.
-
Class Modeling Time - Count visual displaying the amount of modeling time for the class. Drill down to a list of students, their document names, open event time, modeling time, and modeling duration.
-
Student Assignments - Table visual displaying a list of students by user name, per assignment, and the modeling hours.
-
Assignment Activity - Vertical bar graph visual displaying modeling activity per assignment.
On iOS and Android devices, classes are currently only available for educators in View only mode.
Students are able to access their Classes list and start and/or submit assignments.
Educators can access a student analytics by selecting the Student name on the Members list from any class, and then selecting the Analytics icon (![]() ) at the upper right corner to open the Analytics panel:
) at the upper right corner to open the Analytics panel:
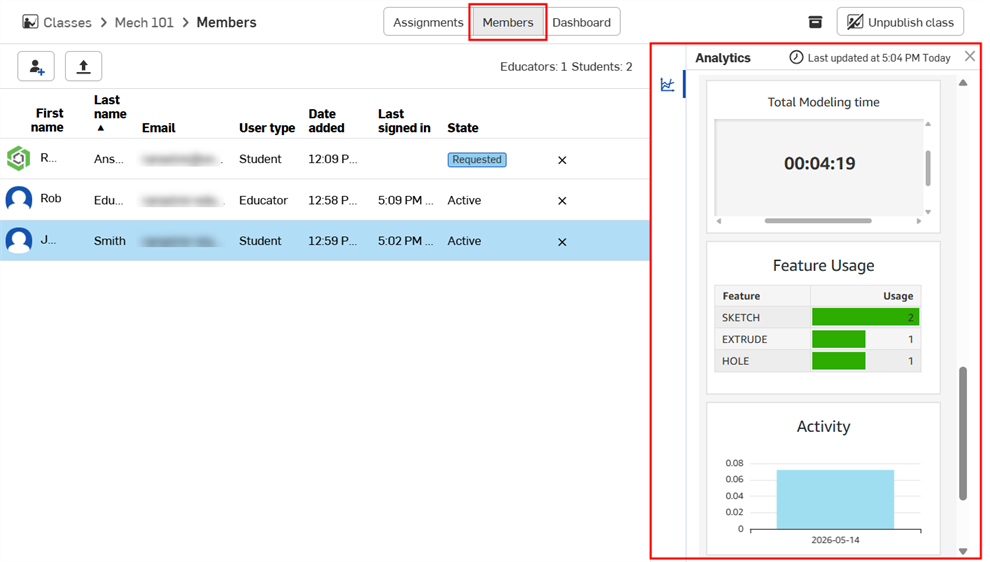
The student dashboard contains information about:
-
The student - Logo or picture representing the student
-
Classes - Count visual displaying the number of classes in which the student is a member
-
Submissions - Count visual displaying the number of submissions made by the student
-
Assignments - Table visual displaying a list of assignments for the user, the name of the Assignment, name of related Document, State (Status), and the Modeling time in hours
-
Time spent on assignments - Count visual displaying the time spent by the student on the assignments
-
Student name - Name of the student
-
Total modeling time - Count visual displaying the total time the student spent modeling.
-
Feature usage - Table visual displaying a list of Onshape feature usage, listed by Feature and number of times those features were used.
-
Activity - Vertical bar chart visual displaying student activity by assignment and date