偏差分析
![]()
在草圖、Part Studio 中提供此功能
顯示在草圖或 Part Studio 中 2 條連續曲線間的最小與最大偏差,或是在 Part Studio 的 2 個曲面間的最小與最大偏差。
步驟
-
從草圖或 Part Studio 中按一下介面右下角的「顯示分析工具」 (
 )。
)。 -
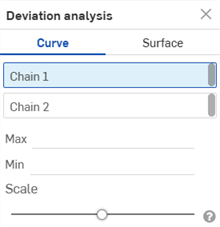
從功能表中選擇偏差分析來開啟對話方塊:
-
在對話方塊中選取了連續 1 的情況下,於圖形區域中選擇一或多條相鄰的曲線。
-
在對話方塊中選取連續 2,然後於圖形區域中選擇一或多條相鄰的曲線。
圖形區域中會顯示最小 (藍色) 與最大 (紅色) 偏差,並會有相對應的極端值點:
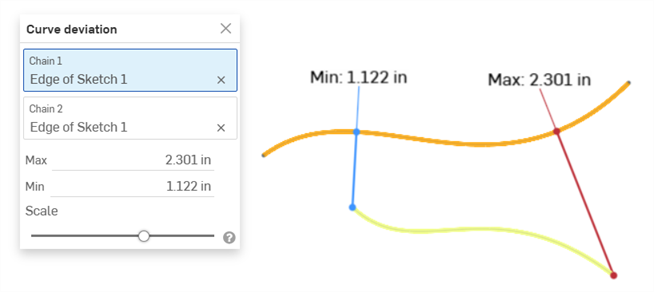
顯示兩條曲線間最大/最小偏差的範例。
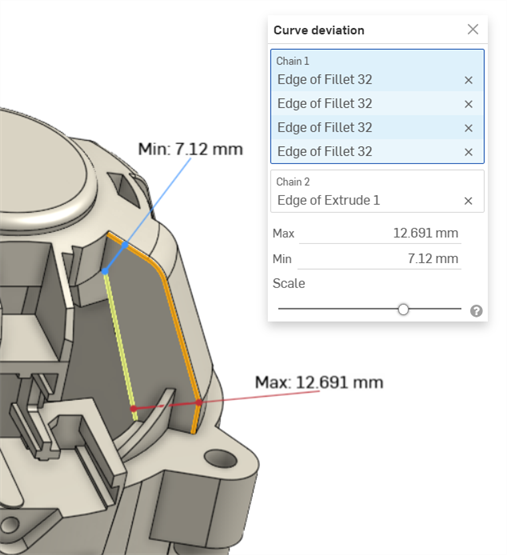
顯示在圓角 (連續 1) 中連續曲線與擠出曲線 (連續 2) 間最大/最小曲線偏差的範例。
-
選擇性地調整比例滑桿來在圖形區域中移動最小與最大的測量標籤。將滑桿向左移動會將標籤移動靠近所選的曲線。將滑桿向右移動會將標籤移動遠離所選的曲線。
曲線偏差計算
如果所選的連續有重合端點,會根據兩個連續的全長來計算偏差。
如果所選的連續沒有重合端點,則所選連續的端點會根據其間的較小最小距離值來配對。
曲線偏差的計算如下:
-
對於每個端點配對組:
-
會計算每個端點到另一連續的最小距離。
-
會使用最低最小距離值的相交點來修剪偏差計算的範圍。
-
會為該範圍計算最大與最小的偏差。
-
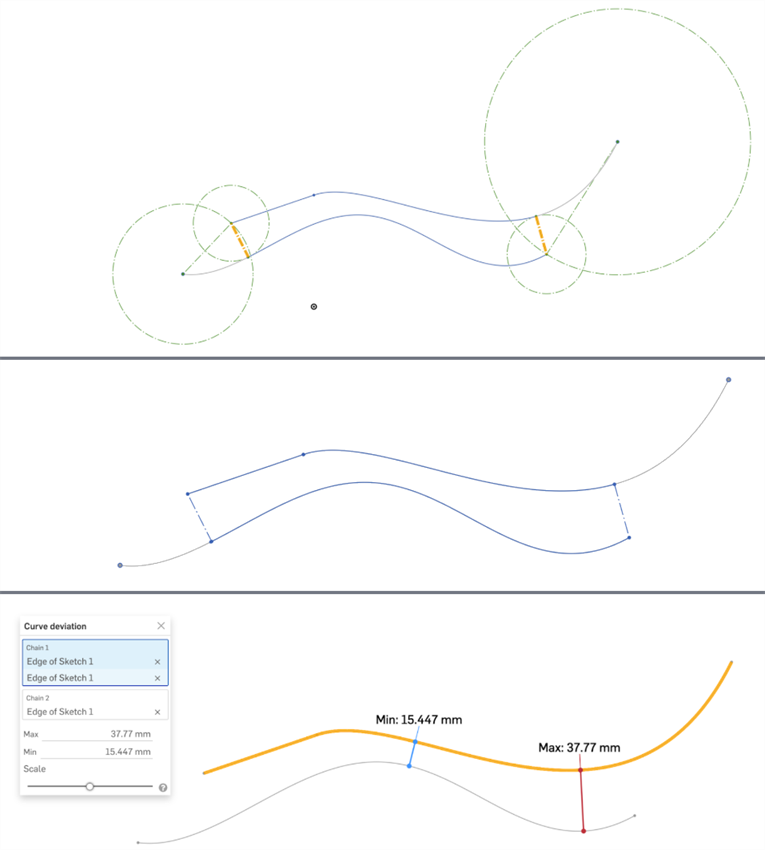
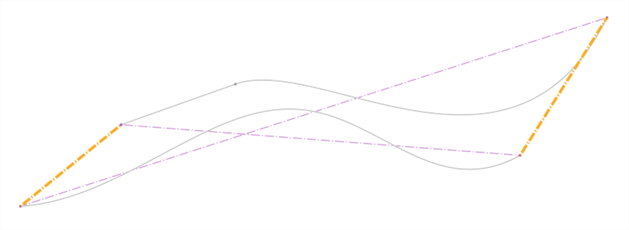
3 個圖片顯示的是同一曲線組。最上方的圖片中以鮮橘色顯示最小距離。可以在第二個圖片中清楚地看到經修剪的曲線 (右端的上方曲線和左端的下方曲線)。最下方的圖片顯示為上方兩個圖片中所示範圍計算出來的最大與最小偏差。
注意
-
為每個連續所選的曲線必須是連續的。
-
如果連續之間的多個極值點有相同的最大或最小偏差值,則僅會顯示一個。
-
如果您剛好就選擇 2 條曲線,接著開啟「曲線偏差」對話方塊,則會將第一條所選曲線自動放置在連續 1 欄位中,第二條選取的曲線則會放置在連續 2 欄位中,系統會自動計算兩條曲線間的最小/最大偏差。
步驟
-
在 Part Studio 中按一下介面右下角的「顯示分析工具」(
) 。 -
從功能表中選擇偏差分析來開啟對話方塊:
-
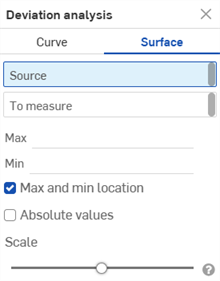
選擇曲面:
-
當在對話方塊中選取了曲面時,請在圖形區域中選擇一個曲面。
-
在圖形區域中選擇要來測量的曲面。
-
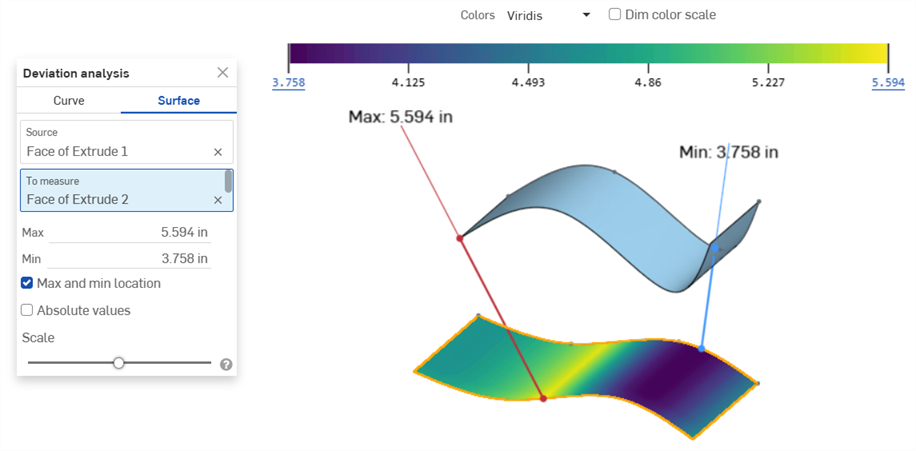
會在圖形區域中會顯示最小 (藍線) 與最大 (紅線) 偏差,並會有相對應的極端值點。被測量的曲面也會顯示從深藍 (最小偏差) 到鮮黃 (最大偏差) 的一個色階:
-
選用,如果最小或最大值之一是負的,按一下絕對值來將其變為正的。請參考 曲面偏差計算。
-
選擇性地調整比例滑桿來在圖形區域中移動最小與 最大的測量標籤。將滑桿向左移動會將標籤移動靠近所選的曲面。將滑桿向右移動會將標籤移動遠離所選的曲面。
曲面色階與圖例
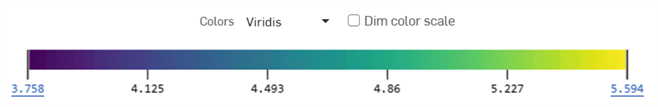
當為曲面偏差分析載入結果時,色階與結果會出現在圖形區域的最上方。沿著色帶底部的六個刻度代表在每個不同色調的偏差量:
將滑鼠移動至圖例的任意處暫留。當游標變為手形圖示 (![]() ) 時,您可以拖放色階將其停靠在圖形區域的任一側。
) 時,您可以拖放色階將其停靠在圖形區域的任一側。
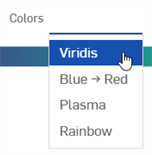
按一下色彩欄位來選擇一個偏差色彩圖例:
-
Viridis - 範圍從深藍 (最小偏差) 到鮮黃 (最大偏差),中間範圍是青色與綠色。這是預設的色階。
-
藍色 → 紅色 - 範圍從淡藍 (最小偏差) 到深紅 (最大偏差)。
-
Plasma -範圍從深藍 (最小偏差) 到鮮黃 (最大偏差),中間範圍是紫色與粉紅色。
-
Rainbow - 使用色譜中的所有值;範圍從藍色 (最小偏差) 到紅色 (最大偏差)。
使用者可以調整下限 (最小) 與上限 (最大) 偏偏差值以提高最小值或降低最大值。按一下值即會有一欄位開啟可供輸入新值。另一個方法是點按並向上拖曳最小值,或是向下拖曳最大值。
系統會使用一個星號 (*) 來表示原始值已經過編輯。按一下重設按鈕 (![]() ) 來恢復原始值:
) 來恢復原始值:
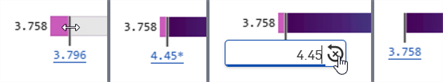
最小偏差值從 3.758 (第一個圖片) 向上調整到 4.45 (第二個圖片)。按一下下限值然後再按一下「重設」圖示 (第三個圖片) 來將最小偏差重設回 3.758 (第四個圖片)。
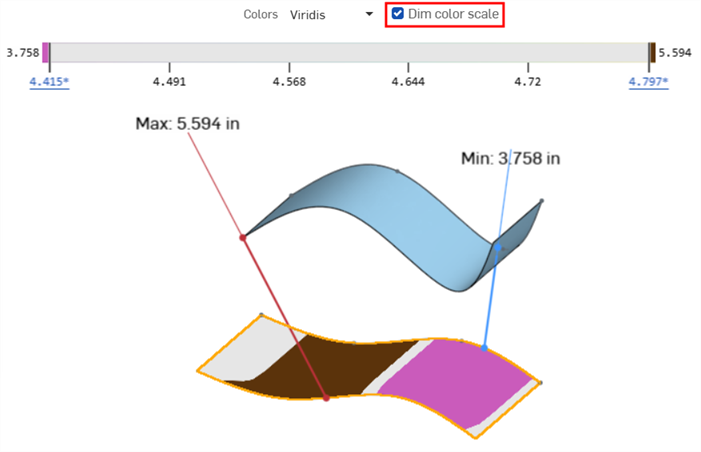
調整最小/最大值之後,按一下暗色階只會為測量曲面中的上限 (棕色) 與下限 (粉紅色) 值上色:
曲面偏差計算
曲面偏差計算與曲線計算類素,除了下列事項:
-
僅在 2 個曲面 (來源) 與 (來測量) 間測量偏差。無法計算多個曲面或曲面連續。
-
曲面的計算是單邊的。取決於來測量曲面相對與來源曲面的位置,最小/最大值可能會是負的。啟用絕對值核取方塊來將這些值調整為正的:
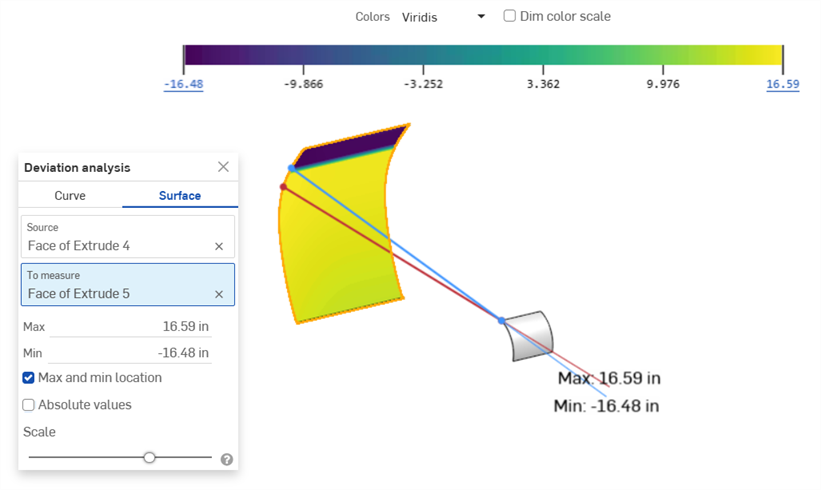
範例顯示負的「最小」值 (-16.48 in)
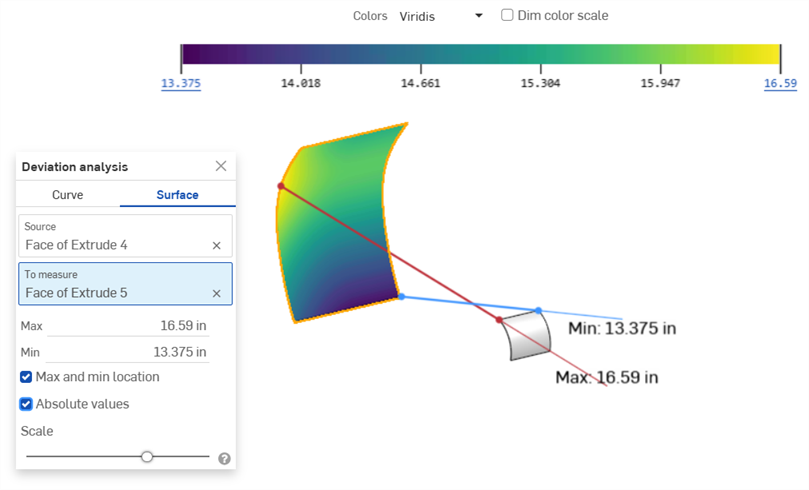
啟用「絕對值」來將負的「最小」值調整為正的 (13.375 in)