曲线/曲面分析
![]()
可用于:草图、Part Studio、装配体
快捷方式:shift+c
曲线/曲面分析功能允许您在 Part Studio 中使用各种方法对草图或零件进行曲率可视化和分析。通过快捷方式 (Shift+c)、草图、零件或曲面上的环境菜单或界面右下角的“显示分析”工具菜单来访问“曲线/曲面分析”对话。
在草图模式下或编辑草图时,您可以使用快捷方式 Shift+c 自动选择所有草图曲线,并打开“曲率/曲面分析”对话框。Shift+c 作为切换开关:在仍然选中的同时,可打开和关闭对话框。
即使在退出草图之后,曲率/曲面处理工具也会保持打开状态,不过,选择输入框不会处于激活状态。您可以添加更多选择,或移除选择,只要工具处于打开状态即可。如果您在打开工具之前进行预选,则工具会打开且仅包含该选择,同时清除了先前进行的任何其他选择。
若要检查曲线和曲面,请执行以下操作:
- 单击界面右下角的“显示分析工具”图标 (
 )。
)。 - 选择曲线/曲面分析打开对话框。您也可以通过右键单击图形区域中的草图或零件并在环境菜单中选择来访问此对话框:
-
选择要分析的边和面。或者,您可以在访问对话框之前选择它们。
- Select from the following options:
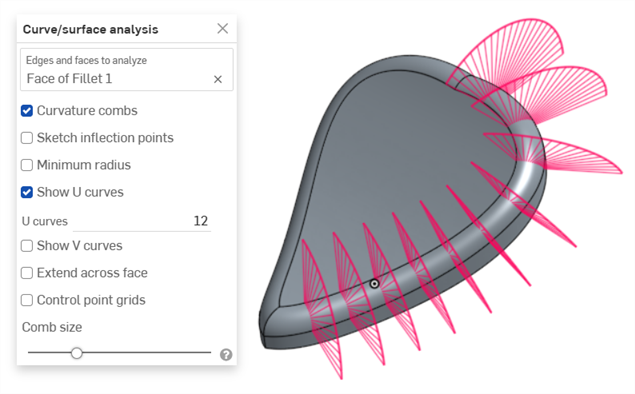
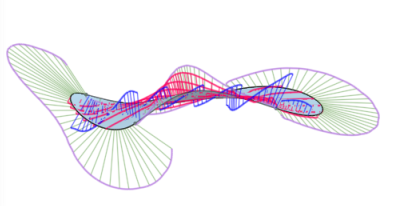
Curvature combs - Displays the combs of the selected edge(s) and/or face(s) along the U and V directions. Curvature combs are evaluated at evenly spaced isolines, not necessarily at the control points, and are used for evaluating the resultant shape of a curve/surface up to Flow (G3) continuity.
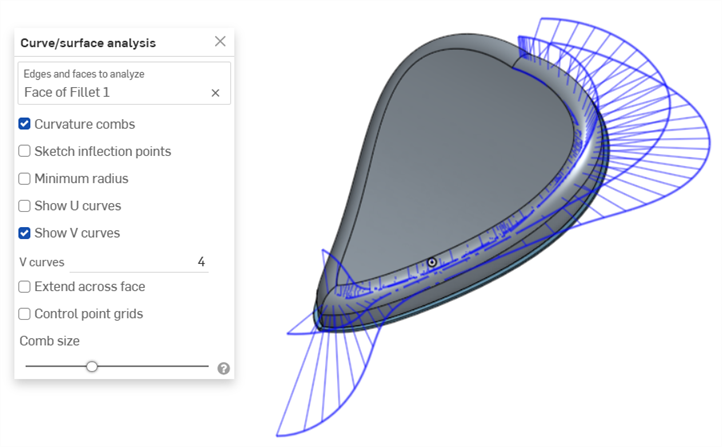
Curvature combs on the V direction on a face
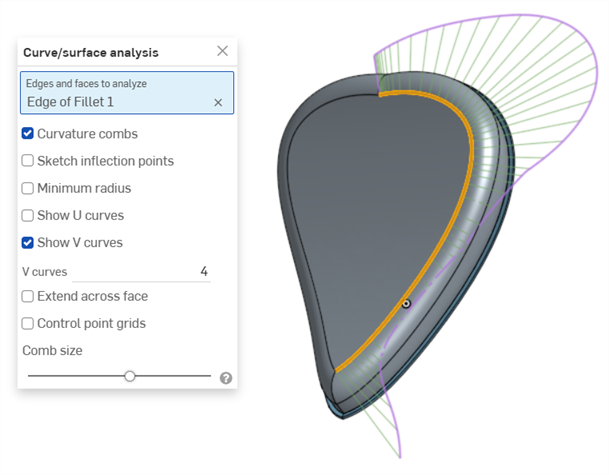
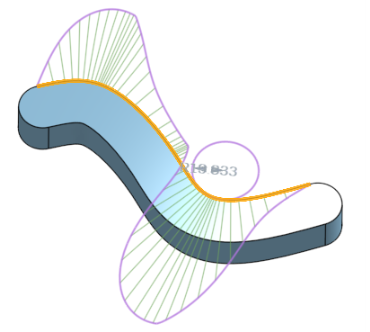
Curvature combs on an edge. Combs are shown in green, bounded in magenta.
Show U curves - Displays curvature combs along the U direction. U curves are displayed in red:
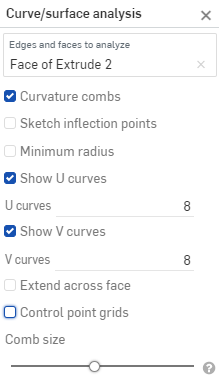
Show V curves - Displays curvature combs along the V direction. V curves are displayed in blue:
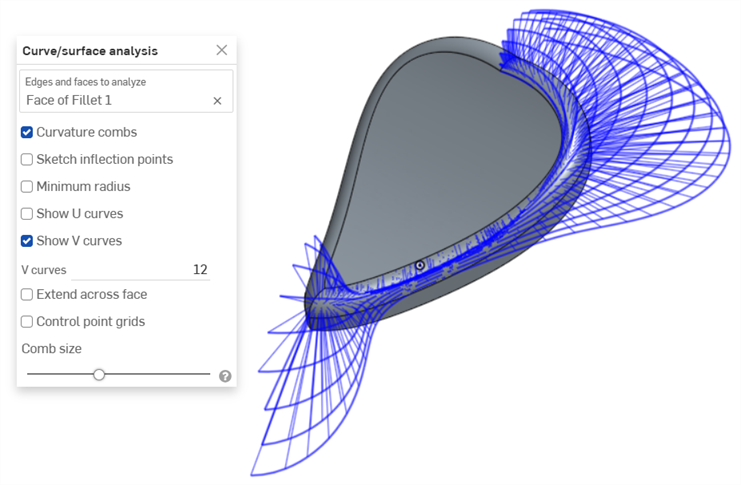
Increase or decrease the number of curves using the numeric U curves and V curves fields, from 2 to 64. The default is 8 for each.
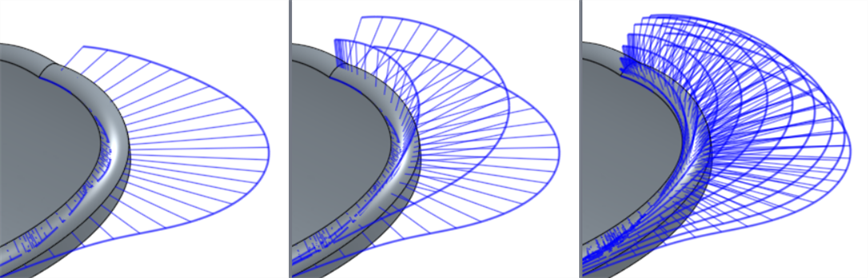
V curves set at 2 (left), 4 (middle), and 8 (right)
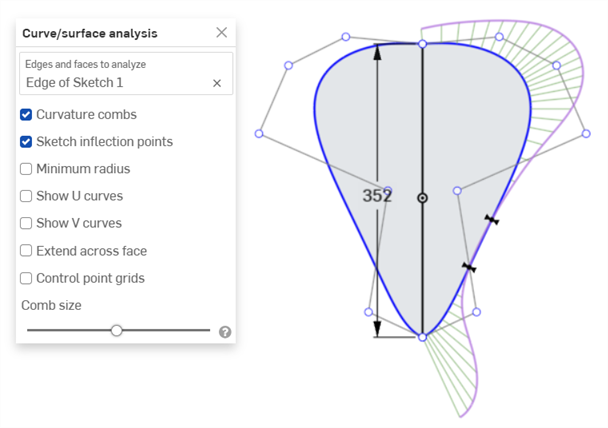
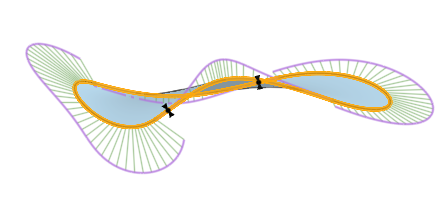
Sketch inflection points (sketch only) - Displays the inflection points along a sketch edge. They appear as black 'bow ties':
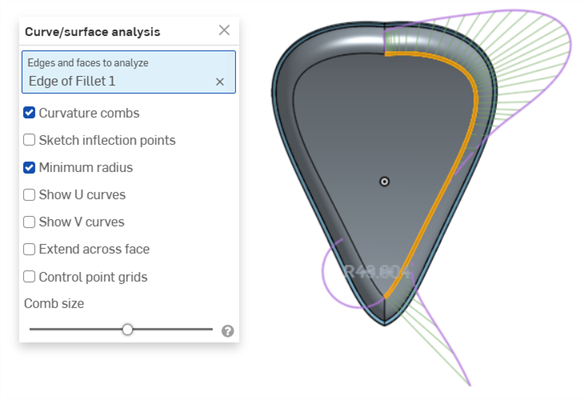
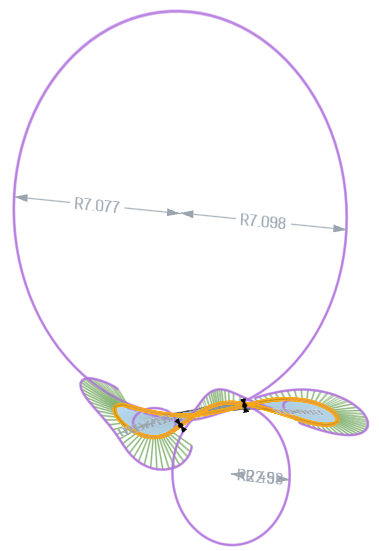
Minimum radius (edges only) - Shows the minimum radius along an edge, either a sketch or part edge:
Extend across face - Extends the curvature combs along adjacent faces:
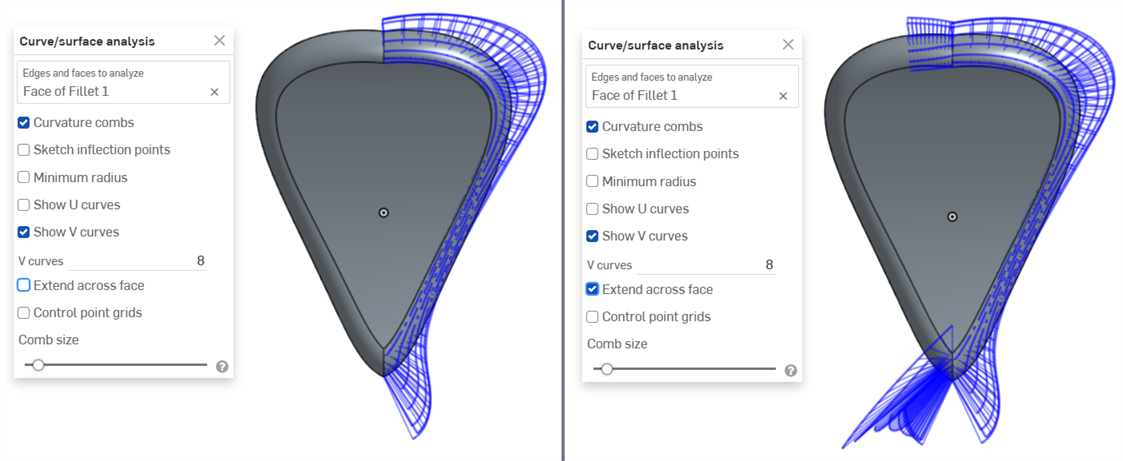
Curvature combs not extended across faces (left) and extended across faces (right)
Control point grids - Displays the control points grid for the selected edge, either a sketch or part edge. This is the location of the control points on the underlying bSpline curves that define the surface (or curve). The number and distribution of the control points provides important information about the underlying math defining the shape.
Dense clusters of control points indicate potential problem areas, and can be deleterious to the surface quality. In short, control point grid is used to understand the underlying mathematical definition of the surface/curve,
Control point grids are shown in magenta:
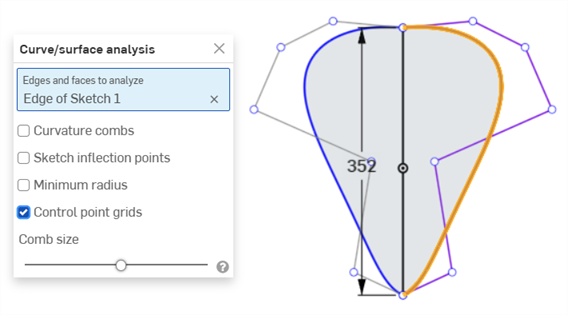
Control point grids displayed in magenta
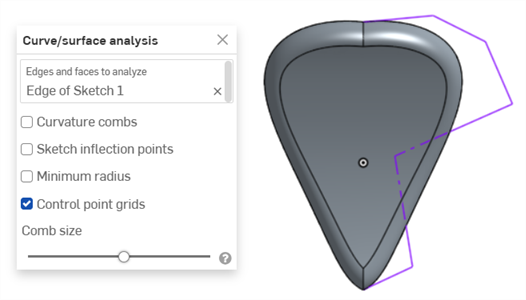
Control point grids displayed with the sketch closed and the part displayed
Knot points - Displays the knot points on the selected curve or surface. (Not available for non-spline entities such as cylindrical faces, intersection curves, offset curves, etc.)
Details - Displays details (such as degree, spans, and number of control points) upon hovering over the selected curve or surface. (Not available for non-spline entities such as cylindrical faces, intersection curves, offset curves, etc.)
Comb size - Use the slider at the bottom of the dialog to adjust the magnitude of the combs.
-
如有必要,单击并拖动一条曲线以调整曲率。当您拖动时,曲率梳会动态更新。
-
完成后,单击以
 关闭曲线/曲面分析对话框。
您还可以显示正在处理的特征的曲率梳,例如,在拉伸过程中:
- 打开特征对话框后,在图形区域中右键单击,然后选择曲线/曲面分析以打开曲线/曲面分析对话框:
- 选择特征的曲线:
- 您可以显示用于创建新特征的选定边的曲率(取消选中“显示预览边的曲率”),或选择显示预览边的曲率以查看正在创建的新特征边的曲率梳:
您还可以通过在“显示曲率”对话框中选中相应选项左侧的框来显示曲率梳、反曲率点和最小半径:
在“显示曲率”对话框中选中了“为预览的边显示”、“显示曲率梳”、“显示反曲率点”和“显示最小半径”的情况下,特征的示例。
有关曲线和曲面分析的更多信息,请参见曲面建模。