曲率/サーフェス分析
![]()
利用可能: スケッチ、Part Studio、アセンブリ
ショートカット: Shift+C
[曲線/サーフェス分析] では、Part Studio のスケッチまたはパーツ上のさまざまな方法を使用して、曲率を視覚化して解析します。曲線/サーフェス分析ダイアログボックスには、ショートカットキー (Shift+C)、スケッチ、パーツ、またはサーフェスのコンテキストメニュー、またはインターフェイスの右下隅にある [分析ツールを表示] メニューからアクセスできます。
スケッチモードまたはスケッチの編集中に、ショートカット Shift+C を使用してすべてのスケッチ曲線を自動的に選択し、曲線/サーフェス分析ダイアログを開くことができます。Shift+C は切り替えの役割を果たします。選択中は、ダイアログが開いたり閉じたりします。
曲率/サーフェスの分析ツールはスケッチを終了した後も開いたままですが、選択フィールドはアクティブではありません。ツールが開いている間は、選択範囲をさらに追加することも、選択を解除することもできます。選択内容に対する変更は、次回ツールを起動したときまで保持されます。ツールを開く前に選択した場合は、その選択内容だけでツールが開き、それまで行った他の選択はすべてクリアされます。
曲率とサーフェスを調べるには、次の手順を実行します。
- インターフェイスの右下隅にある [分析ツールを表示] アイコン (
 ) をクリックします。
 - [曲線/サーフェス分析] を選択してダイアログを開きます。このダイアログにアクセスするには、グラフィック領域のスケッチまたはパーツを右クリックし、コンテキストメニューで選択することもできます。
-
分析するエッジと面を選択します。または、ダイアログにアクセスする前にも選択できます。
- Select from the following options:
Curvature combs - Displays the combs of the selected edge(s) and/or face(s) along the U and V directions. Curvature combs are evaluated at evenly spaced isolines, not necessarily at the control points, and are used for evaluating the resultant shape of a curve/surface up to Flow (G3) continuity.
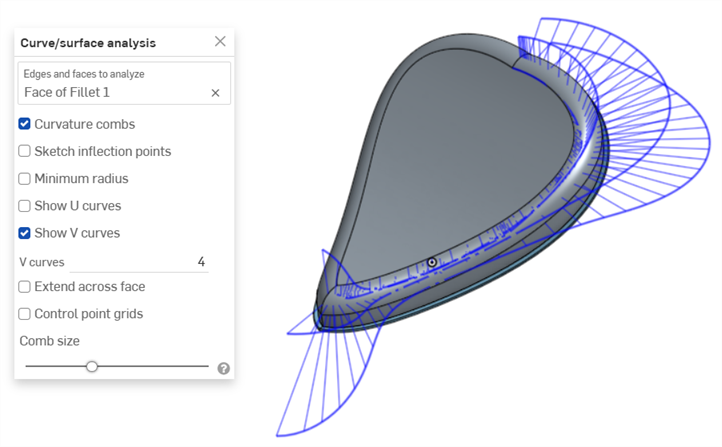
Curvature combs on the V direction on a face
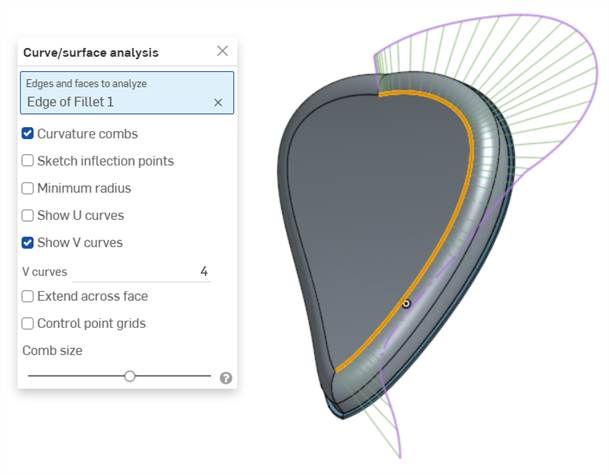
Curvature combs on an edge. Combs are shown in green, bounded in magenta.
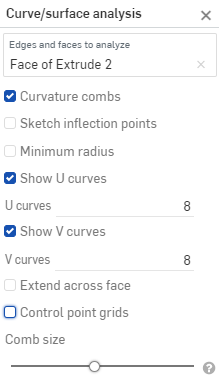
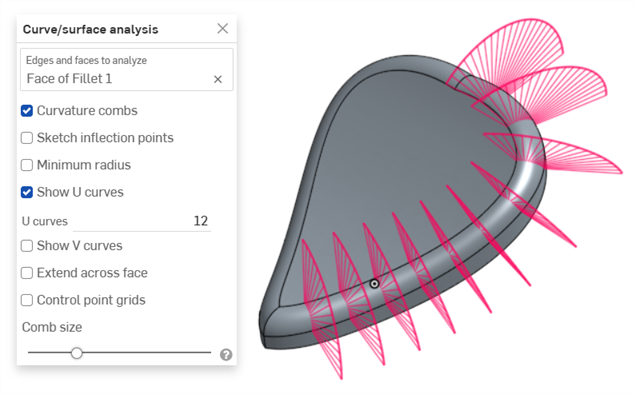
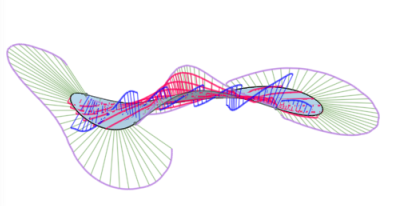
Show U curves - Displays curvature combs along the U direction. U curves are displayed in red:
Show V curves - Displays curvature combs along the V direction. V curves are displayed in blue:
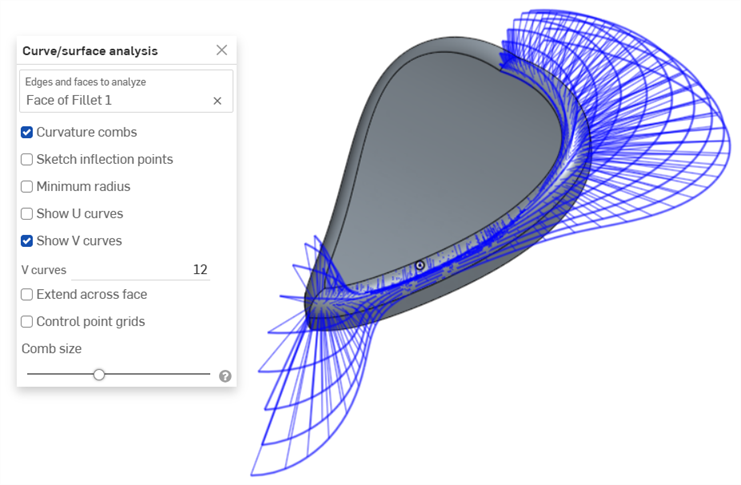
Increase or decrease the number of curves using the numeric U curves and V curves fields, from 2 to 64. The default is 8 for each.
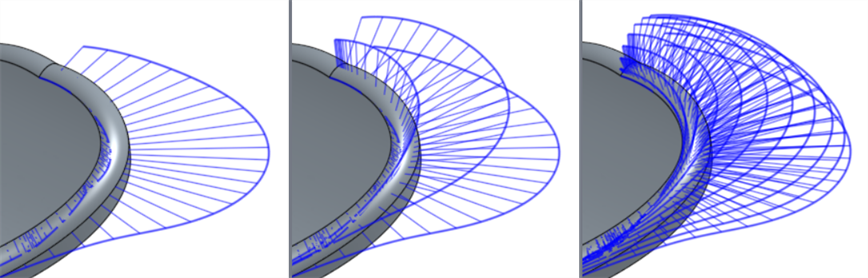
V curves set at 2 (left), 4 (middle), and 8 (right)
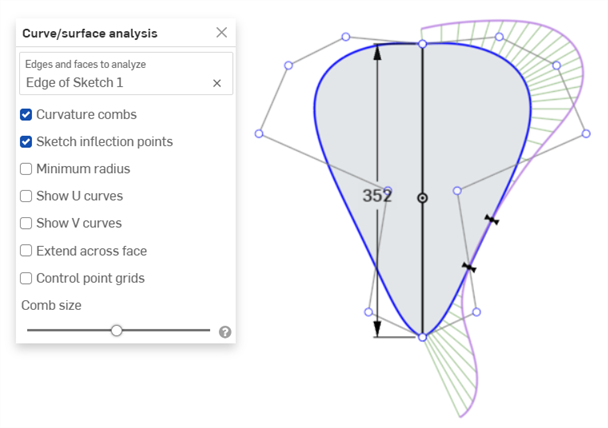
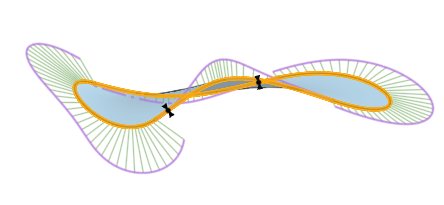
Sketch inflection points (sketch only) - Displays the inflection points along a sketch edge. They appear as black 'bow ties':
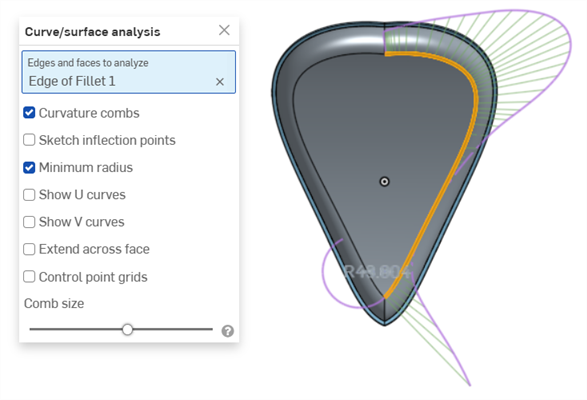
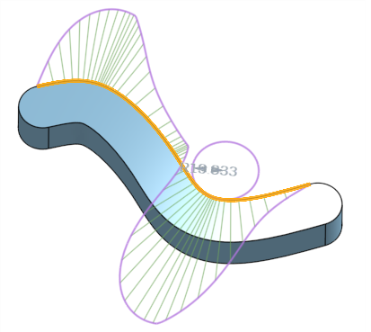
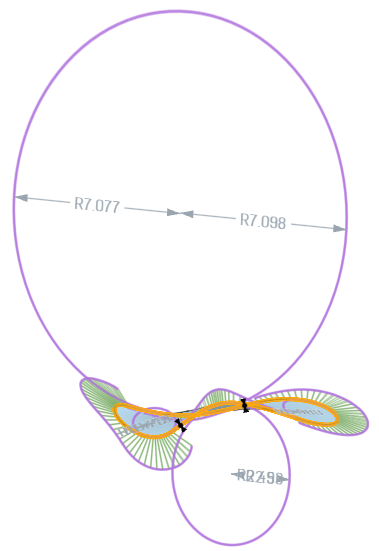
Minimum radius (edges only) - Shows the minimum radius along an edge, either a sketch or part edge:
Extend across face - Extends the curvature combs along adjacent faces:
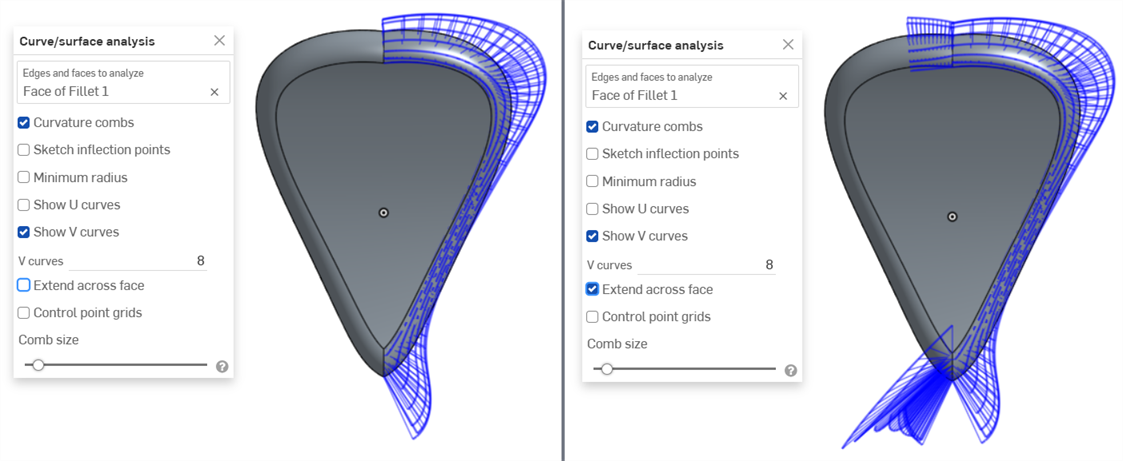
Curvature combs not extended across faces (left) and extended across faces (right)
Control point grids - Displays the control points grid for the selected edge, either a sketch or part edge. This is the location of the control points on the underlying bSpline curves that define the surface (or curve). The number and distribution of the control points provides important information about the underlying math defining the shape.
Dense clusters of control points indicate potential problem areas, and can be deleterious to the surface quality. In short, control point grid is used to understand the underlying mathematical definition of the surface/curve,
Control point grids are shown in magenta:
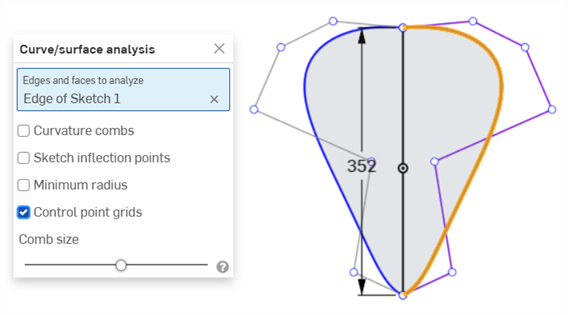
Control point grids displayed in magenta
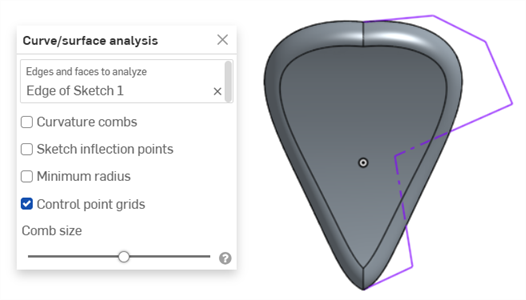
Control point grids displayed with the sketch closed and the part displayed
Knot points - Displays the knot points on the selected curve or surface. (Not available for non-spline entities such as cylindrical faces, intersection curves, offset curves, etc.)
Details - Displays details (such as degree, spans, and number of control points) upon hovering over the selected curve or surface. (Not available for non-spline entities such as cylindrical faces, intersection curves, offset curves, etc.)
Comb size - Use the slider at the bottom of the dialog to adjust the magnitude of the combs.
-
必要に応じて、曲線をドラッグし、曲率を調整します。ドラッグ中は、コームが動的に更新されます。
-
終了したら、
 をクリックして [曲線/サーフェス分析] ダイアログを閉じます。
また、押し出し中など、処理中のフィーチャーの曲率コームを表示することもできます。
- [フィーチャー] ダイアログを開いた状態で、グラフィック領域を右クリックして [曲線/サーフェス分析] を選択し、[曲線/サーフェス分析] ダイアログを開きます。
- フィーチャーの曲線を選択します。
- 新しいフィーチャーの作成に使用する選択したエッジの曲率を表示するか ([プレビュー済みのエッジの表示] をオフにします)、[プレビュー済みのエッジの表示] をオンにして、作成する新しいフィーチャーのエッジの曲率コームを確認できます。
[曲率を表示] ダイアログボックス (下図) のオプションの左側にあるボックスを選択して、曲率コーム、変曲点、最小半径を表示することもできます。
[曲率を表示] ダイアログボックスで、[プレビューしたエッジに表示]、[曲率コームを表示]、[変曲点を表示]、および [最小半径を表示] が選択されたフィーチャーの例
曲線とサーフェスの分析について詳しくは、サーフェスモデリングを参照してください。