Analyse de la déviation
![]()
Disponible dans : Esquisse, Part Studio
Affichez la déviation minimum et maximum entre 2 chaînes de courbes dans une esquisse ou un Part Studio, ou entre 2 surfaces dans un Part Studio.
Étapes
-
À partir d'une esquisse ou d'un Part Studio, cliquez sur l'icône Afficher les outils d'analyse (
 ) dans le coin inférieur droit de l'interface.
 -
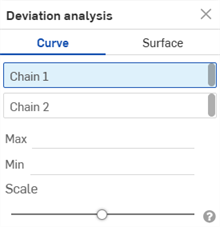
Dans le menu, sélectionnez Analyse de la déviation pour ouvrir la boîte de dialogue :
-
En sélectionnant Chaîne 1 dans la boîte de dialogue, sélectionnez une ou plusieurs courbes adjacentes dans la zone graphique.
-
Sélectionnez Chaîne 2 dans la boîte de dialogue et sélectionnez une ou plusieurs courbes adjacentes dans la zone graphique.
Les déviations minimale (bleu) et maximale (rouge) sont affichées dans la zone graphique, ainsi que les points extrêmes correspondants :
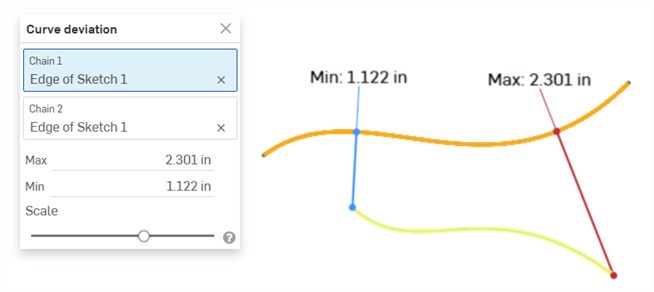
Exemple montrant la déviation Max/Min entre deux courbes.
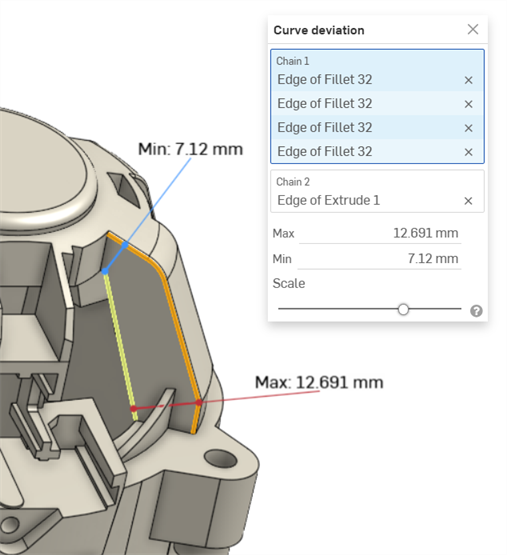
Exemple montrant la déviation de courbe Max/Min entre les courbes en chaîne dans un congé (chaîne 1) et une courbe extrudée (chaîne 2).
-
Vous pouvez aussi ajuster le curseur Échelle pour déplacer les étiquettes de mesure Min et Max dans la zone graphique. Le réglage du curseur vers la gauche permet de rapprocher les étiquettes des courbes sélectionnées. Le déplacement du curseur vers la droite éloigne les étiquettes des courbes sélectionnées.
Calcul de la déviation de courbe
Si les chaînes sélectionnées ont des points finaux coïncidents, la déviation est calculée sur la longueur totale des deux chaînes.
Si les chaînes sélectionnées n'ont pas de points finaux coïncidents, les points finaux des chaînes sélectionnées sont associés sur la base de la valeur minimale la plus faible de la distance entre eux.
La déviation de courbe est calculée comme suit :
-
Pour chaque paire de points final :
-
La distance minimale entre chaque point final et l'autre chaîne est calculée.
-
La plage pour le calcul de la déviation est ajustée en utilisant le point d'intersection de la valeur de distance minimale la plus basse.
-
Les déviations maximales et minimales sont calculées pour cette plage.
-
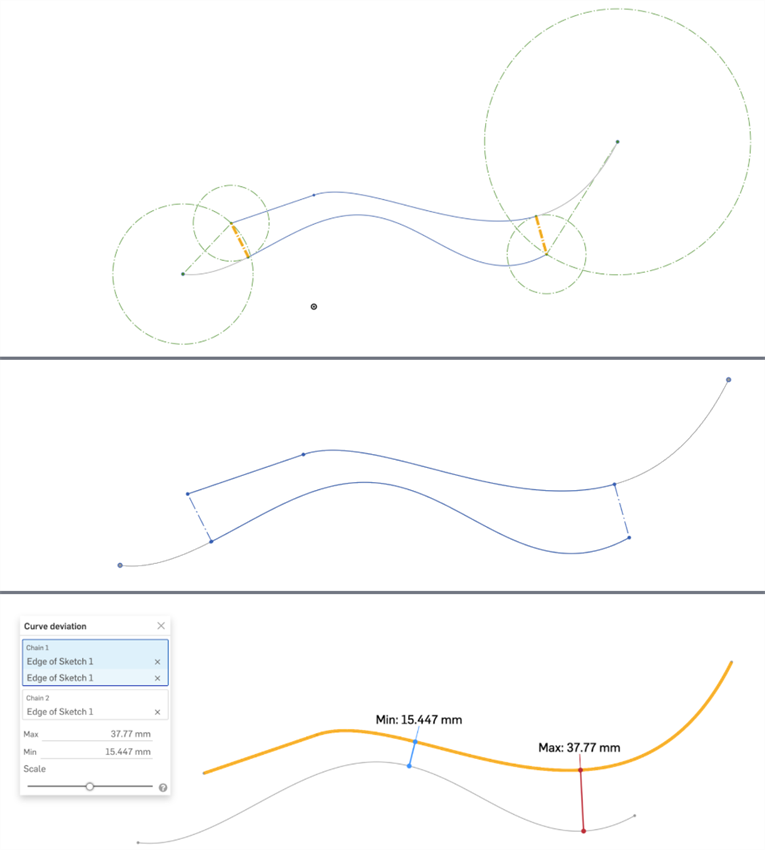
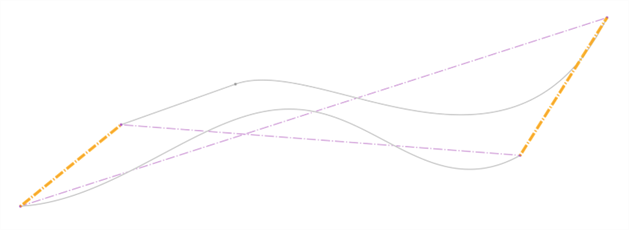
Les 3 images présentent le même ensemble de courbes. La distance minimale est affichée en orange gras dans l'image du haut. Les courbes ajustées sont facilement visibles sur la deuxième image (la courbe du haut à l'extrémité droite et la courbe inférieure à l'extrémité gauche). L'image du bas affiche les écarts maximum et minimum calculés pour la plage indiquée dans les deux images du haut.
Remarques
-
Les courbes sélectionnées pour chaque chaîne doivent être continues.
-
S'il existe plusieurs points finaux avec la même valeur de déviation maximale ou minimale entre les chaînes, une seule est affichée.
-
Si vous sélectionnez exactement 2 courbes, puis que vous ouvrez la boîte de dialogue Déviation de la courbe, la première courbe sélectionnée est automatiquement placée dans le champ Chaîne 1 et la seconde dans le champ Chaîne 2, calculant automatiquement la déviation min/max entre les deux courbes.
Étapes
-
À partir d'un Part Studio, cliquez sur l'icône Afficher les outils d'analyse (
) dans le coin inférieur droit de l'interface. -
Dans le menu, sélectionnez Analyse de la déviation pour ouvrir la boîte de dialogue :
-
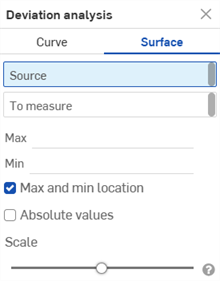
Sélectionnez Surface :
-
Lorsque Source est sélectionnée dans la boîte de dialogue, sélectionnez une surface dans la zone graphique.
-
Sélectionnez une surface Jusqu'à la mesure dans la zone graphique.
-
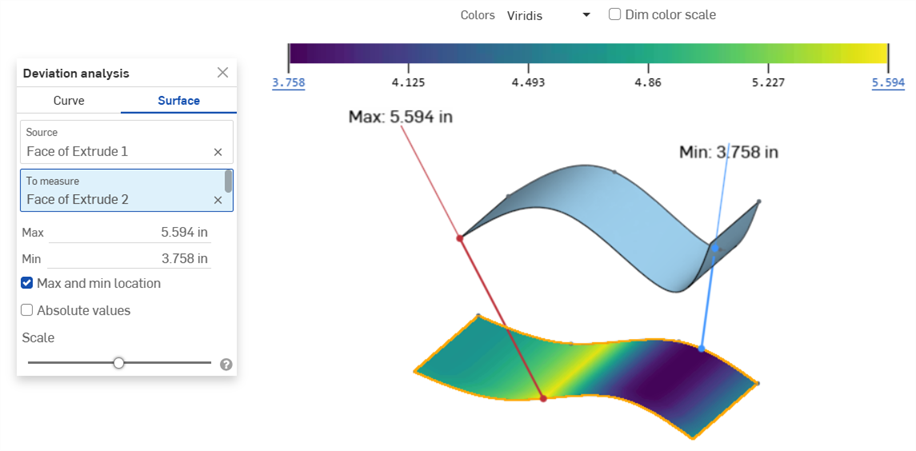
Les déviations minimale (ligne bleue) et maximale (ligne rouge) sont affichées dans la zone graphique, avec les points extrêmes correspondants. La surface mesurée affiche également une échelle de couleurs, allant du bleu foncé (déviation la plus faible) au jaune vif (déviation la plus importante) :
-
Si les valeurs Min ou Max sont négatives, vous pouvez également cliquer sur Valeurs absolues pour les rendre positives. Voir Calcul de la déviation de surface.
-
Vous pouvez également ajuster le curseur Échelle pour déplacer les étiquettes de mesure Min et Max dans la zone graphique. Le déplacement du curseur vers la gauche rapproche les étiquettes des surfaces sélectionnées. Le déplacement du curseur vers la droite éloigne les en éloigne.
Échelle et légende des couleurs de la surface
Lorsque les résultats sont chargés pour une analyse de la déviation de surface, l'échelle de couleurs et les résultats apparaissent en haut de la zone graphique. Les six coches situées au bas de la bande de couleurs indiquent l'intensité de la déviation pour chaque teinte différente :
Passez votre souris n'importe où sur la légende. Lorsque le curseur devient une icône en forme de main (![]() ), vous pouvez glisser-déposer l'échelle pour l'ancrer de n'importe quel côté de la zone graphique.
), vous pouvez glisser-déposer l'échelle pour l'ancrer de n'importe quel côté de la zone graphique.
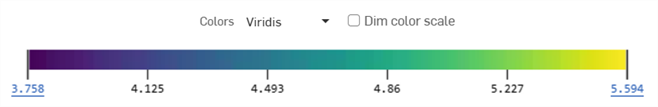
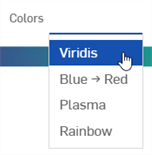
Cliquez sur le champ Couleurs afin de sélectionner une légende des couleurs pour la déviation :
-
Viridis - Échelle de couleurs allant du bleu foncé (déviation la plus faible) au jaune vif (déviation la plus importante), le cyan et le vert se situant au milieu. Il s'agit de l'échelle par défaut.
-
Bleu → Rouge - Plage de couleurs allant du bleu clair (déviation la plus faible) au rouge foncé (déviation la plus importante).
-
Plasma - Plage de couleurs allant du bleu foncé (déviation la plus faible) au jaune vif (déviation la plus importante), le violet et le rose se situant au milieu.
-
Arc-en-ciel - Utilise toutes les valeurs du spectre de couleurs, du bleu (déviation la plus faible) au rouge (déviation la plus importante).
Les valeurs de déviation inférieure (minimale) et supérieure (maximale) peuvent être ajustées par l'utilisateur afin d'augmenter la valeur minimale ou de réduire la valeur maximale. Cliquez sur la valeur pour ouvrir un champ dans lequel vous pourrez saisir la nouvelle valeur. Vous pouvez également cliquer et faire glisser la valeur minimale vers le haut ou la valeur maximale vers le bas.
Un astérisque (*) est utilisé pour indiquer que la valeur d'origine a été modifiée. Cliquez sur le bouton Réinitialiser (![]() ) pour revenir à la valeur initiale :
) pour revenir à la valeur initiale :
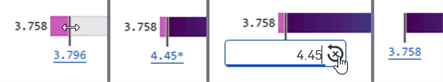
La valeur de déviation minimale est ajustée à la hausse de 3,758 (première image) à 4,45 (deuxième image). Cliquez sur la valeur limite inférieure puis sur l'icône de réinitialisation (troisième image) pour ramener la déviation minimale à 3,758 (quatrième image).
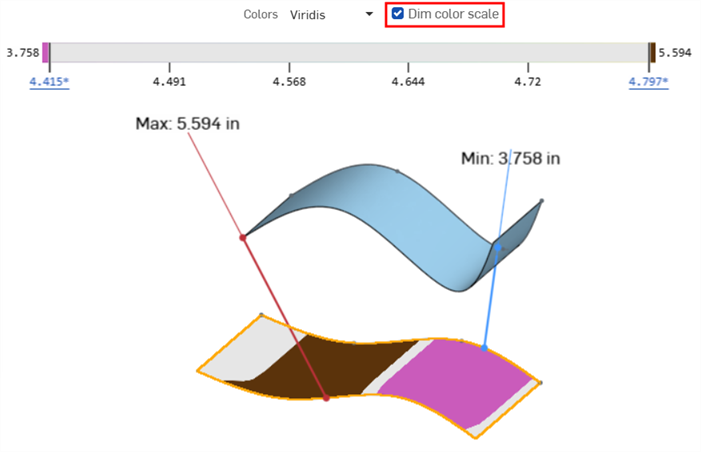
Lorsque les valeurs Min/Max sont ajustées, le fait de cliquer sur l'Échelle de couleurs de la cote permet de colorer uniquement les valeurs supérieures (marron) et inférieures (rose) de la surface mesurée :
Calcul de la déviation de surface
Le calcul de la déviation de surface est similaire au calcul de la courbe, à l'exception des points suivants :
-
La déviation est mesurée uniquement entre 2 surfaces (Source et Jusqu'à la mesure). Les surfaces multiples ou les chaînes de surfaces ne peuvent pas être calculées.
-
Le calcul de la surface est unilatéral. Selon l'endroit où se trouve la surface Jusqu'à la mesure par rapport à la surface Source, les valeurs Min/Max peuvent être négatives. Cochez la case Valeurs absolues pour passer ces valeurs à des valeurs positives :
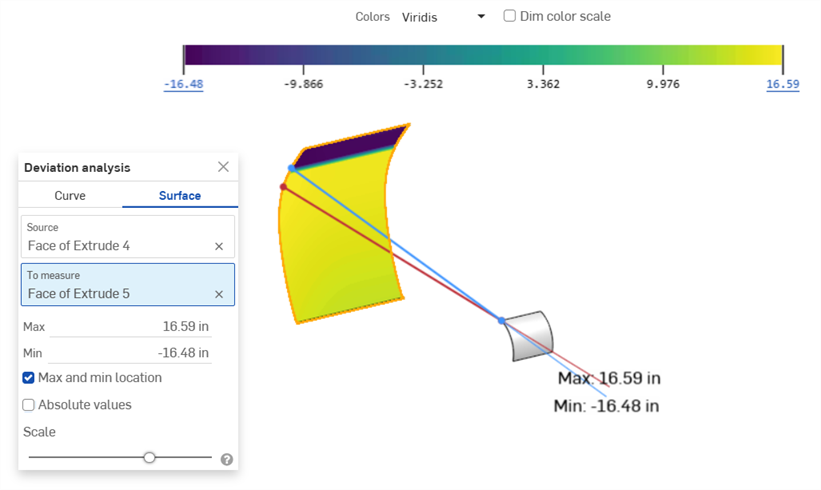
Exemple montrant une valeur minimale négative (-16,48 pouces)
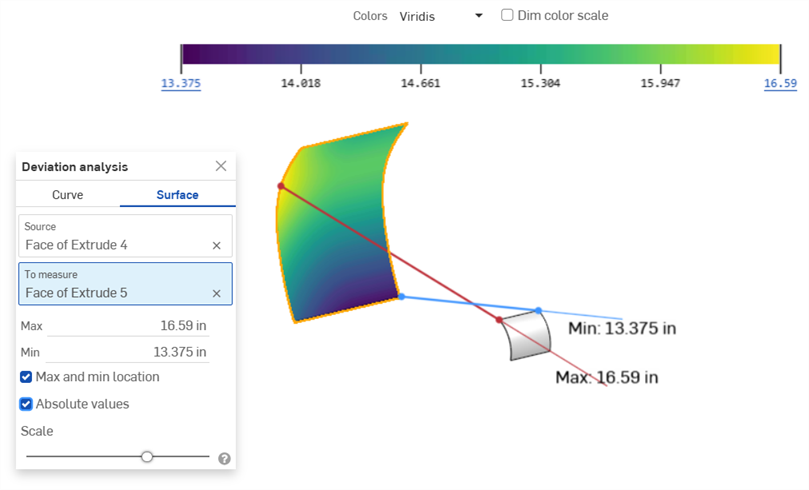
L'activation des valeurs absolues fait passer la valeur minimale négative à une valeur positive (13,375 pouces)