Carte en couleurs de la courbure
![]()
Disponible dans : Esquisse, Part Studio
La palette de couleurs de courbure permet d'étudier plus en profondeur la courbure en appliquant le dégradé de couleur de votre choix sur une face ou une surface dans un Atelier des pièces. Vous pouvez ajuster l'échelle du dégradé de couleurs et choisir parmi différents types de palettes de couleurs pour obtenir la meilleure représentation visuelle afin de discerner la continuité de surface et la transition entre les arêtes.
-
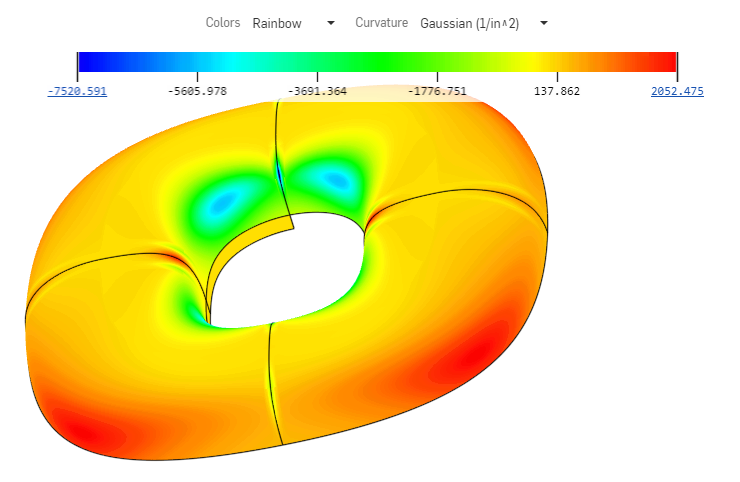
Cliquez sur l'icône Afficher les outils d'analyse (
 ) dans le coin inférieur droit de l'interface. Dans le menu, sélectionnez Carte en couleurs de la courbure :
Cela applique une palette de couleurs aux faces et aux surfaces de la zone graphique, en utilisant un dégradé de couleurs pour montrer la courbure sur une échelle :
Les options permettant de visualiser la courbure à l'aide d'une palette de couleurs incluent :
-
Définition des couleurs de la palette. Cliquez sur le menu déroulant pour sélectionner la palette de couleurs la mieux adaptée à vos besoins et à vos préférences de visualisation :
-
Viridis - Une gamme allant du violet foncé au vert clair
-
Bleu - > rouge - Une échelle allant du bleu au rouge
-
Plasma - Une gamme allant du bleu foncé au jaune clair
-
Arc-en-ciel - Une gamme de couleurs de l'arc-en-ciel
-
-
Sélection d'un graphique pour la carte. Cliquez sur le menu déroulant pour sélectionner un graphique spécifique :
-
Gaussien - Base l'attribution des couleurs sur le produit des rayons maximum et minimum à un point donné. La courbure est affichée comme l'inverse du rayon.
-
Moyenne - Base l'attribution des couleurs sur la moyenne des rayons maximum et minimum à un point donné.
-
Rayon maximal - Base l'attribution des couleurs sur la valeur maximale du rayon à un point donné.
-
Rayon min. - Base l'attribution des couleurs sur la valeur minimale du rayon à un point donné.
-
Vous pouvez déplacer la palette de couleurs à n'importe quel endroit de la zone graphique pour améliorer l'affichage du modèle et de la carte. Passez le curseur de la souris sur le graphique jusqu'à ce que le pointeur de la souris apparaisse en croix. Cliquez sur le graphique et faites-le glisser vers un nouvel emplacement. Pour certains emplacements, le graphique est réorienté vers une position verticale. Les listes déroulantes Couleurs et Courbure restent en haut de la zone graphique, quel que soit l'emplacement du graphique.
-
Lorsque la surface ou la face ne présente aucune courbure, Onshape n'attribue aucune valeur à l'échelle de la palette de couleurs, car aucun calcul de rayons n'est effectué. La palette de couleurs est toujours visible et vous pouvez toujours sélectionner parmi les palettes et les couleurs. Aucune couleur de courbure n'est appliquée si aucune valeur n'est calculée. Le modèle reste de la même couleur avant l'ouverture des outils d'analyse de courbure.
-
Vous pouvez modifier l'échelle en cliquant sur ses extrémités et en les rapprochant l'une de l'autre. Les points de l'échelle sont recalculés et les couleurs sont actualisées sur les faces et les surfaces selon la nouvelle échelle. Vous pouvez également cliquer sur une valeur et la saisir dans le champ pour ajuster l'échelle. Assurez-vous de cliquer sur la petite icône d'actualisation.